

Agilent Spectrum Analysis Basics - Agilent Technologies
Agilent Spectrum Analysis Basics - Agilent Technologies
Agilent Spectrum Analysis Basics - Agilent Technologies

You also want an ePaper? Increase the reach of your titles
YUMPU automatically turns print PDFs into web optimized ePapers that Google loves.
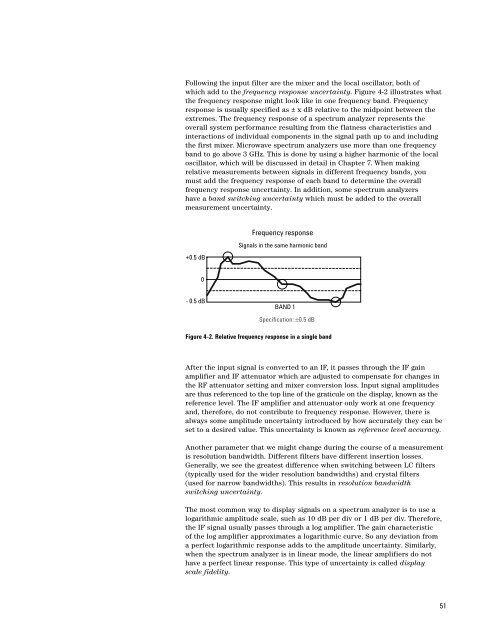
Following the input filter are the mixer and the local oscillator, both of<br />
which add to the frequency response uncertainty. Figure 4-2 illustrates what<br />
the frequency response might look like in one frequency band. Frequency<br />
response is usually specified as ± x dB relative to the midpoint between the<br />
extremes. The frequency response of a spectrum analyzer represents the<br />
overall system performance resulting from the flatness characteristics and<br />
interactions of individual components in the signal path up to and including<br />
the first mixer. Microwave spectrum analyzers use more than one frequency<br />
band to go above 3 GHz. This is done by using a higher harmonic of the local<br />
oscillator, which will be discussed in detail in Chapter 7. When making<br />
relative measurements between signals in different frequency bands, you<br />
must add the frequency response of each band to determine the overall<br />
frequency response uncertainty. In addition, some spectrum analyzers<br />
have a band switching uncertainty which must be added to the overall<br />
measurement uncertainty.<br />
+0.5 dB<br />
Frequency response<br />
Signals in the same harmonic band<br />
0<br />
- 0.5 dB<br />
BAND 1<br />
Specification: ±0.5 dB<br />
Figure 4-2. Relative frequency response in a single band<br />
After the input signal is converted to an IF, it passes through the IF gain<br />
amplifier and IF attenuator which are adjusted to compensate for changes in<br />
the RF attenuator setting and mixer conversion loss. Input signal amplitudes<br />
are thus referenced to the top line of the graticule on the display, known as the<br />
reference level. The IF amplifier and attenuator only work at one frequency<br />
and, therefore, do not contribute to frequency response. However, there is<br />
always some amplitude uncertainty introduced by how accurately they can be<br />
set to a desired value. This uncertainty is known as reference level accuracy.<br />
Another parameter that we might change during the course of a measurement<br />
is resolution bandwidth. Different filters have different insertion losses.<br />
Generally, we see the greatest difference when switching between LC filters<br />
(typically used for the wider resolution bandwidths) and crystal filters<br />
(used for narrow bandwidths). This results in resolution bandwidth<br />
switching uncertainty.<br />
The most common way to display signals on a spectrum analyzer is to use a<br />
logarithmic amplitude scale, such as 10 dB per div or 1 dB per div. Therefore,<br />
the IF signal usually passes through a log amplifier. The gain characteristic<br />
of the log amplifier approximates a logarithmic curve. So any deviation from<br />
a perfect logarithmic response adds to the amplitude uncertainty. Similarly,<br />
when the spectrum analyzer is in linear mode, the linear amplifiers do not<br />
have a perfect linear response. This type of uncertainty is called display<br />
scale fidelity.<br />
51


