

Agilent Spectrum Analysis Basics - Agilent Technologies
Agilent Spectrum Analysis Basics - Agilent Technologies
Agilent Spectrum Analysis Basics - Agilent Technologies

You also want an ePaper? Increase the reach of your titles
YUMPU automatically turns print PDFs into web optimized ePapers that Google loves.
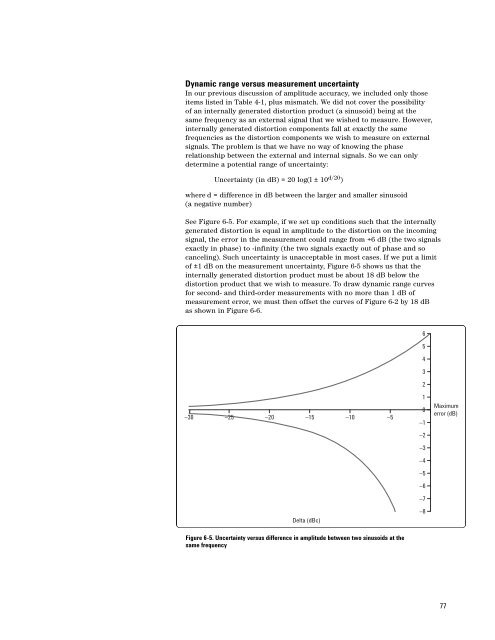
Dynamic range versus measurement uncertainty<br />
In our previous discussion of amplitude accuracy, we included only those<br />
items listed in Table 4-1, plus mismatch. We did not cover the possibility<br />
of an internally generated distortion product (a sinusoid) being at the<br />
same frequency as an external signal that we wished to measure. However,<br />
internally generated distortion components fall at exactly the same<br />
frequencies as the distortion components we wish to measure on external<br />
signals. The problem is that we have no way of knowing the phase<br />
relationship between the external and internal signals. So we can only<br />
determine a potential range of uncertainty:<br />
Uncertainty (in dB) = 20 log(l ± 10 d/20 )<br />
where d = difference in dB between the larger and smaller sinusoid<br />
(a negative number)<br />
See Figure 6-5. For example, if we set up conditions such that the internally<br />
generated distortion is equal in amplitude to the distortion on the incoming<br />
signal, the error in the measurement could range from +6 dB (the two signals<br />
exactly in phase) to -infinity (the two signals exactly out of phase and so<br />
canceling). Such uncertainty is unacceptable in most cases. If we put a limit<br />
of ±1 dB on the measurement uncertainty, Figure 6-5 shows us that the<br />
internally generated distortion product must be about 18 dB below the<br />
distortion product that we wish to measure. To draw dynamic range curves<br />
for second- and third-order measurements with no more than 1 dB of<br />
measurement error, we must then offset the curves of Figure 6-2 by 18 dB<br />
as shown in Figure 6-6.<br />
6<br />
5<br />
4<br />
3<br />
2<br />
–30 –25<br />
–20 –15 –10 –5<br />
Delta (dBc)<br />
1<br />
0<br />
–1<br />
–2<br />
–3<br />
–4<br />
–5<br />
–6<br />
–7<br />
–8<br />
Maximum<br />
error (dB)<br />
Figure 6-5. Uncertainty versus difference in amplitude between two sinusoids at the<br />
same frequency<br />
77


