- Page 1 and 2: Agilent Spectrum Analysis Basics Ap
- Page 3 and 4: Table of Contents — continued Cha
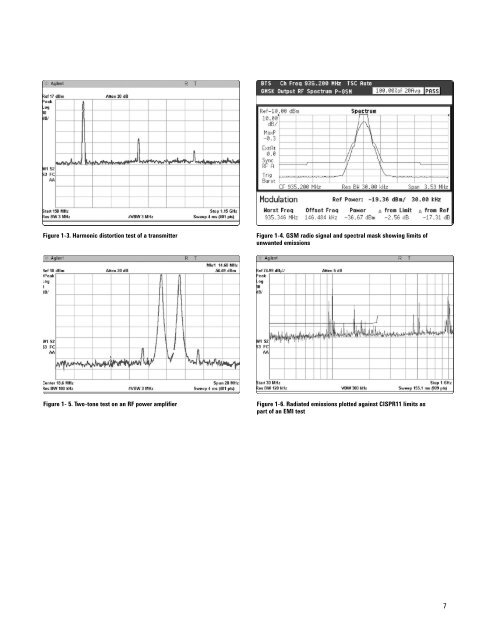
- Page 5: Some measurements require that we p
- Page 9 and 10: While we have defined spectrum anal
- Page 11 and 12: Since the output of a spectrum anal
- Page 13 and 14: We need to pick an LO frequency and
- Page 15 and 16: To separate closely spaced signals
- Page 17 and 18: Agilent data sheets describe the ab
- Page 19 and 20: This allows us to calculate the fil
- Page 21 and 22: Some modern spectrum analyzers allo
- Page 23 and 24: On the other hand, the rise time of
- Page 25 and 26: The width of the resolution (IF) fi
- Page 27 and 28: The “bucket” concept is importa
- Page 29 and 30: Peak (positive) detection One way t
- Page 31 and 32: The normal detection algorithm: If
- Page 33 and 34: EMI detectors: average and quasi-pe
- Page 35 and 36: The effect is most noticeable in me
- Page 37 and 38: Thus, the display gradually converg
- Page 39 and 40: In some cases, time-gating capabili
- Page 41 and 42: Timeslots 0 1 2 3 4 5 6 7 Timeslots
- Page 43 and 44: Gated sweep Gated sweep, sometimes
- Page 45 and 46: In Chapter 2, we did a filter skirt
- Page 47 and 48: Custom signal processing IC Turning
- Page 49 and 50: Chapter 4 Amplitude and Frequency A
- Page 51 and 52: Following the input filter are the
- Page 53 and 54: Improving overall uncertainty When
- Page 55 and 56: Examples Let’s look at some ampli
- Page 57 and 58:
In a factory setting, there is ofte
- Page 59 and 60:
Because the input attenuator has no
- Page 61 and 62:
Noise figure Many receiver manufact
- Page 63 and 64:
Using these expressions, we’ll se
- Page 65 and 66:
Let’s first test the two previous
- Page 67 and 68:
This is the 2.5 dB factor that we a
- Page 69 and 70:
When we add a preamplifier to our a
- Page 71 and 72:
2D dB 3D dB 3D dB 3D dB With a cons
- Page 73 and 74:
We can construct a similar line for
- Page 75 and 76:
Figure 6-2 shows the dynamic range
- Page 77 and 78:
Dynamic range versus measurement un
- Page 79 and 80:
Let’s see what happened to our dy
- Page 81 and 82:
The range of the log amplifier can
- Page 83 and 84:
Chapter 7 Extending the Frequency R
- Page 85 and 86:
Next let’s see to what extent har
- Page 87 and 88:
In examining Figure 7-5, we find so
- Page 89 and 90:
Can we conclude from this discussio
- Page 91 and 92:
Amplitude calibration So far, we ha
- Page 93 and 94:
From the graph, we see that a -10 d
- Page 95 and 96:
Pluses and minuses of preselection
- Page 97 and 98:
Table 7-1 shows the harmonic mixing
- Page 99 and 100:
Figure 7-15. Which ones are the rea
- Page 101 and 102:
Figure 7-18. The image suppress fun
- Page 103 and 104:
Other examples of built-in measurem
- Page 105 and 106:
Digital modulation analysis The com
- Page 107 and 108:
Data transfer and remote instrument
- Page 109 and 110:
Summary The objective of this appli
- Page 111 and 112:
Delta marker: A mode in which a fix
- Page 113 and 114:
Frequency stability: A general phra
- Page 115 and 116:
LO feedthrough: The response on the
- Page 117 and 118:
Residual responses: Discrete respon
- Page 119 and 120:
Video: In a spectrum analyzer, a te