

Agilent Spectrum Analysis Basics - Agilent Technologies
Agilent Spectrum Analysis Basics - Agilent Technologies
Agilent Spectrum Analysis Basics - Agilent Technologies

You also want an ePaper? Increase the reach of your titles
YUMPU automatically turns print PDFs into web optimized ePapers that Google loves.
External harmonic mixer<br />
Input<br />
signal<br />
Atten<br />
3 GHz<br />
3.9214 GHz<br />
321.4 MHz 21.4 MHz<br />
Analog or<br />
digital IF<br />
Input<br />
signal<br />
3 - 7 GHz<br />
3.6 GHz<br />
300 MHz<br />
Preselector<br />
321.4 MHz<br />
Sweep<br />
generator<br />
Display<br />
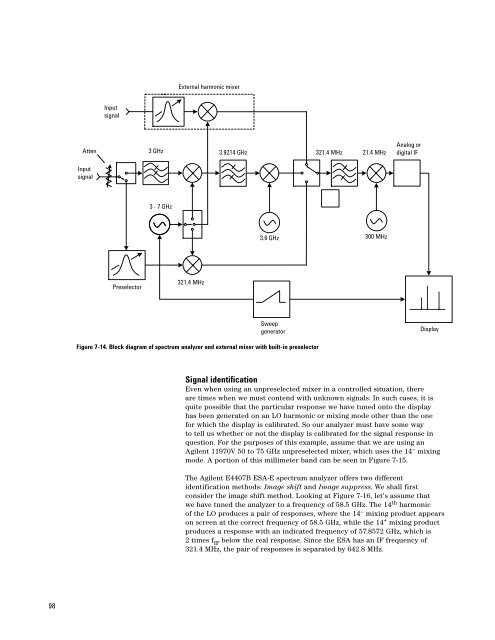
Figure 7-14. Block diagram of spectrum analyzer and external mixer with built-in preselector<br />
Signal identification<br />
Even when using an unpreselected mixer in a controlled situation, there<br />
are times when we must contend with unknown signals. In such cases, it is<br />
quite possible that the particular response we have tuned onto the display<br />
has been generated on an LO harmonic or mixing mode other than the one<br />
for which the display is calibrated. So our analyzer must have some way<br />
to tell us whether or not the display is calibrated for the signal response in<br />
question. For the purposes of this example, assume that we are using an<br />
<strong>Agilent</strong> 11970V 50 to 75 GHz unpreselected mixer, which uses the 14 – mixing<br />
mode. A portion of this millimeter band can be seen in Figure 7-15.<br />
The <strong>Agilent</strong> E4407B ESA-E spectrum analyzer offers two different<br />
identification methods: Image shift and Image suppress. We shall first<br />
consider the image shift method. Looking at Figure 7-16, let’s assume that<br />
we have tuned the analyzer to a frequency of 58.5 GHz. The 14 th harmonic<br />
of the LO produces a pair of responses, where the 14 – mixing product appears<br />
on screen at the correct frequency of 58.5 GHz, while the 14 + mixing product<br />
produces a response with an indicated frequency of 57.8572 GHz, which is<br />
2 times f IF below the real response. Since the ESA has an IF frequency of<br />
321.4 MHz, the pair of responses is separated by 642.8 MHz.<br />
98


