

Agilent Spectrum Analysis Basics - Agilent Technologies
Agilent Spectrum Analysis Basics - Agilent Technologies
Agilent Spectrum Analysis Basics - Agilent Technologies

Create successful ePaper yourself
Turn your PDF publications into a flip-book with our unique Google optimized e-Paper software.
The normal detection algorithm:<br />
If the signal rises and falls within a bucket:<br />
Even numbered buckets display the minimum (negative peak)<br />
value in the bucket. The maximum is remembered.<br />
Odd numbered buckets display the maximum (positive peak)<br />
value determined by comparing the current bucket peak with<br />
the previous (remembered) bucket peak.<br />
If the signal only rises or only falls within a bucket, the peak<br />
is displayed. See Figure 2-25.<br />
This process may cause a maximum value to be displayed one data point too<br />
far to the right, but the offset is usually only a small percentage of the span.<br />
Some spectrum analyzers, such as the <strong>Agilent</strong> PSA Series, compensate for<br />
this potential effect by moving the LO start and stop frequencies.<br />
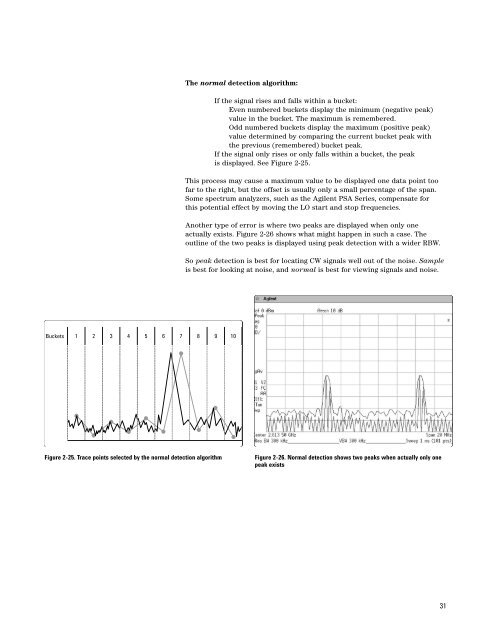
Another type of error is where two peaks are displayed when only one<br />
actually exists. Figure 2-26 shows what might happen in such a case. The<br />
outline of the two peaks is displayed using peak detection with a wider RBW.<br />
So peak detection is best for locating CW signals well out of the noise. Sample<br />
is best for looking at noise, and normal is best for viewing signals and noise.<br />
Buckets 1 2 3 4 5 6 7 8 9 10<br />
Figure 2-25. Trace points selected by the normal detection algorithm<br />
Figure 2-26. Normal detection shows two peaks when actually only one<br />
peak exists<br />
31


