

Agilent Spectrum Analysis Basics - Agilent Technologies
Agilent Spectrum Analysis Basics - Agilent Technologies
Agilent Spectrum Analysis Basics - Agilent Technologies

Create successful ePaper yourself
Turn your PDF publications into a flip-book with our unique Google optimized e-Paper software.
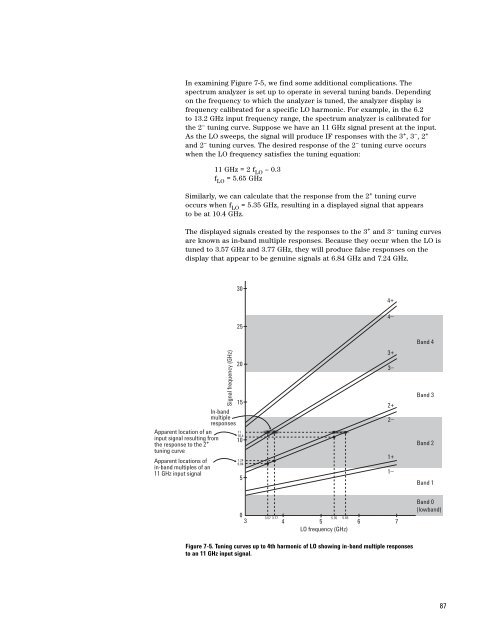
In examining Figure 7-5, we find some additional complications. The<br />
spectrum analyzer is set up to operate in several tuning bands. Depending<br />
on the frequency to which the analyzer is tuned, the analyzer display is<br />
frequency calibrated for a specific LO harmonic. For example, in the 6.2<br />
to 13.2 GHz input frequency range, the spectrum analyzer is calibrated for<br />
the 2 – tuning curve. Suppose we have an 11 GHz signal present at the input.<br />
As the LO sweeps, the signal will produce IF responses with the 3 + , 3 – , 2 +<br />
and 2 – tuning curves. The desired response of the 2 – tuning curve occurs<br />
when the LO frequency satisfies the tuning equation:<br />
11 GHz = 2 f LO – 0.3<br />
f LO = 5.65 GHz<br />
Similarly, we can calculate that the response from the 2 + tuning curve<br />
occurs when f LO = 5.35 GHz, resulting in a displayed signal that appears<br />
to be at 10.4 GHz.<br />
The displayed signals created by the responses to the 3 + and 3 – tuning curves<br />
are known as in-band multiple responses. Because they occur when the LO is<br />
tuned to 3.57 GHz and 3.77 GHz, they will produce false responses on the<br />
display that appear to be genuine signals at 6.84 GHz and 7.24 GHz.<br />
30<br />
4+<br />
Apparent location of an<br />
input signal resulting from<br />
the response to the 2 +<br />
tuning curve<br />
Apparent locations of<br />
in-band multiples of an<br />
11 GHz input signal<br />
Signal frequency (GHz)<br />
In-band<br />
multiple<br />
responses<br />
25<br />
20<br />
15<br />
11<br />
10.4<br />
10<br />
7.24<br />
6.84<br />
5<br />
4–<br />
3+<br />
3–<br />
2+<br />
2–<br />
1+<br />
1–<br />
Band 4<br />
Band 3<br />
Band 2<br />
Band 1<br />
0<br />
3<br />
3.57 3.77 5.35 5.65<br />
4<br />
5<br />
LO frequency (GHz)<br />
6<br />
7<br />
Band 0<br />
(lowband)<br />
Figure 7-5. Tuning curves up to 4th harmonic of LO showing in-band multiple responses<br />
to an 11 GHz input signal.<br />
87


