Agilent Spectrum Analysis Basics - Agilent Technologies
Agilent Spectrum Analysis Basics - Agilent Technologies
Agilent Spectrum Analysis Basics - Agilent Technologies
You also want an ePaper? Increase the reach of your titles
YUMPU automatically turns print PDFs into web optimized ePapers that Google loves.
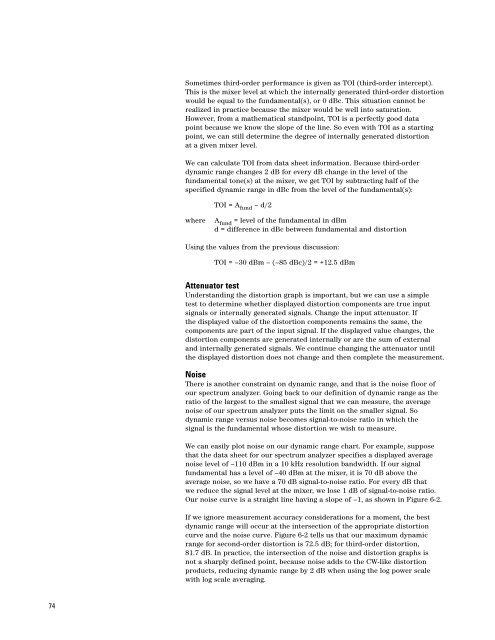
Sometimes third-order performance is given as TOI (third-order intercept).<br />
This is the mixer level at which the internally generated third-order distortion<br />
would be equal to the fundamental(s), or 0 dBc. This situation cannot be<br />
realized in practice because the mixer would be well into saturation.<br />
However, from a mathematical standpoint, TOI is a perfectly good data<br />
point because we know the slope of the line. So even with TOI as a starting<br />
point, we can still determine the degree of internally generated distortion<br />
at a given mixer level.<br />
We can calculate TOI from data sheet information. Because third-order<br />
dynamic range changes 2 dB for every dB change in the level of the<br />
fundamental tone(s) at the mixer, we get TOI by subtracting half of the<br />
specified dynamic range in dBc from the level of the fundamental(s):<br />
TOI = A fund – d/2<br />
where<br />
A fund = level of the fundamental in dBm<br />
d = difference in dBc between fundamental and distortion<br />
Using the values from the previous discussion:<br />
TOI = –30 dBm – (–85 dBc)/2 = +12.5 dBm<br />
Attenuator test<br />
Understanding the distortion graph is important, but we can use a simple<br />
test to determine whether displayed distortion components are true input<br />
signals or internally generated signals. Change the input attenuator. If<br />
the displayed value of the distortion components remains the same, the<br />
components are part of the input signal. If the displayed value changes, the<br />
distortion components are generated internally or are the sum of external<br />
and internally generated signals. We continue changing the attenuator until<br />
the displayed distortion does not change and then complete the measurement.<br />
Noise<br />
There is another constraint on dynamic range, and that is the noise floor of<br />
our spectrum analyzer. Going back to our definition of dynamic range as the<br />
ratio of the largest to the smallest signal that we can measure, the average<br />
noise of our spectrum analyzer puts the limit on the smaller signal. So<br />
dynamic range versus noise becomes signal-to-noise ratio in which the<br />
signal is the fundamental whose distortion we wish to measure.<br />
We can easily plot noise on our dynamic range chart. For example, suppose<br />
that the data sheet for our spectrum analyzer specifies a displayed average<br />
noise level of –110 dBm in a 10 kHz resolution bandwidth. If our signal<br />
fundamental has a level of –40 dBm at the mixer, it is 70 dB above the<br />
average noise, so we have a 70 dB signal-to-noise ratio. For every dB that<br />
we reduce the signal level at the mixer, we lose 1 dB of signal-to-noise ratio.<br />
Our noise curve is a straight line having a slope of –1, as shown in Figure 6-2.<br />
If we ignore measurement accuracy considerations for a moment, the best<br />
dynamic range will occur at the intersection of the appropriate distortion<br />
curve and the noise curve. Figure 6-2 tells us that our maximum dynamic<br />
range for second-order distortion is 72.5 dB; for third-order distortion,<br />
81.7 dB. In practice, the intersection of the noise and distortion graphs is<br />
not a sharply defined point, because noise adds to the CW-like distortion<br />
products, reducing dynamic range by 2 dB when using the log power scale<br />
with log scale averaging.<br />
74


