

Agilent Spectrum Analysis Basics - Agilent Technologies
Agilent Spectrum Analysis Basics - Agilent Technologies
Agilent Spectrum Analysis Basics - Agilent Technologies

Create successful ePaper yourself
Turn your PDF publications into a flip-book with our unique Google optimized e-Paper software.
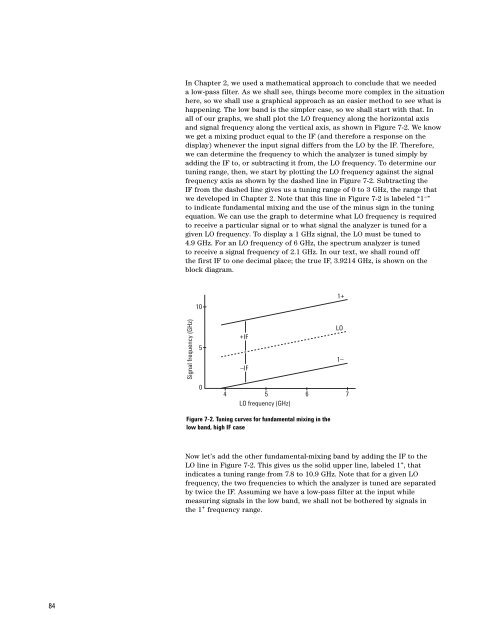
In Chapter 2, we used a mathematical approach to conclude that we needed<br />
a low-pass filter. As we shall see, things become more complex in the situation<br />
here, so we shall use a graphical approach as an easier method to see what is<br />
happening. The low band is the simpler case, so we shall start with that. In<br />
all of our graphs, we shall plot the LO frequency along the horizontal axis<br />
and signal frequency along the vertical axis, as shown in Figure 7-2. We know<br />
we get a mixing product equal to the IF (and therefore a response on the<br />
display) whenever the input signal differs from the LO by the IF. Therefore,<br />
we can determine the frequency to which the analyzer is tuned simply by<br />
adding the IF to, or subtracting it from, the LO frequency. To determine our<br />
tuning range, then, we start by plotting the LO frequency against the signal<br />
frequency axis as shown by the dashed line in Figure 7-2. Subtracting the<br />
IF from the dashed line gives us a tuning range of 0 to 3 GHz, the range that<br />
we developed in Chapter 2. Note that this line in Figure 7-2 is labeled “1 – ”<br />
to indicate fundamental mixing and the use of the minus sign in the tuning<br />
equation. We can use the graph to determine what LO frequency is required<br />
to receive a particular signal or to what signal the analyzer is tuned for a<br />
given LO frequency. To display a 1 GHz signal, the LO must be tuned to<br />
4.9 GHz. For an LO frequency of 6 GHz, the spectrum analyzer is tuned<br />
to receive a signal frequency of 2.1 GHz. In our text, we shall round off<br />
the first IF to one decimal place; the true IF, 3.9214 GHz, is shown on the<br />
block diagram.<br />
1+<br />
10<br />
Signal frequency (GHz)<br />
5<br />
+IF<br />
–IF<br />
LO<br />
1–<br />
0<br />
4<br />
5<br />
LO frequency (GHz)<br />
6<br />
7<br />
Figure 7-2. Tuning curves for fundamental mixing in the<br />
low band, high IF case<br />
Now let’s add the other fundamental-mixing band by adding the IF to the<br />
LO line in Figure 7-2. This gives us the solid upper line, labeled 1 + , that<br />
indicates a tuning range from 7.8 to 10.9 GHz. Note that for a given LO<br />
frequency, the two frequencies to which the analyzer is tuned are separated<br />
by twice the IF. Assuming we have a low-pass filter at the input while<br />
measuring signals in the low band, we shall not be bothered by signals in<br />
the 1 + frequency range.<br />
84


