

Agilent Spectrum Analysis Basics - Agilent Technologies
Agilent Spectrum Analysis Basics - Agilent Technologies
Agilent Spectrum Analysis Basics - Agilent Technologies

You also want an ePaper? Increase the reach of your titles
YUMPU automatically turns print PDFs into web optimized ePapers that Google loves.
Relative uncertainty<br />
When we make relative measurements on an incoming signal, we use either some<br />
part of the same signal or a different signal as a reference. For example, when we<br />
make second harmonic distortion measurements, we use the fundamental of the<br />
signal as our reference. Absolute values do not come into play; we are interested<br />
only in how the second harmonic differs in amplitude from the fundamental.<br />
In a worst-case relative measurement scenario, the fundamental of the<br />
signal may occur at a point where the frequency response is highest, while<br />
the harmonic we wish to measure occurs at the point where the frequency<br />
response is the lowest. The opposite scenario is equally likely. Therefore,<br />
if our relative frequency response specification is ±0.5 dB as shown in<br />
Figure 4-2, then the total uncertainty would be twice that value, or ±1.0 dB.<br />
Perhaps the two signals under test might be in different frequency bands of the<br />
spectrum analyzer. In that case, a rigorous analysis of the overall uncertainty<br />
must include the sum of the flatness uncertainties of the two frequency bands.<br />
Other uncertainties might be irrelevant in a relative measurement, like<br />
the RBW switching uncertainty or reference level accuracy, which apply<br />
to both signals at the same time.<br />
Absolute amplitude accuracy<br />
Nearly all spectrum analyzers have a built-in calibration source which<br />
provides a known reference signal of specified amplitude and frequency.<br />
We then rely on the relative accuracy of the analyzer to translate the absolute<br />
calibration of the reference to other frequencies and amplitudes. <strong>Spectrum</strong><br />
analyzers often have an absolute frequency response specification, where<br />
the zero point on the flatness curve is referenced to this calibration signal.<br />
Many <strong>Agilent</strong> spectrum analyzers use a 50 MHz reference signal. At this<br />
frequency, the specified absolute amplitude accuracy is extremely good:<br />
±0.34 dB for the ESA-E Series and ±0.24 dB for the PSA Series analyzers.<br />
It is best to consider all known uncertainties and then determine which<br />
ones can be ignored when doing a certain type of measurement. The range<br />
of values shown in Table 4-1 represents the specifications of a variety of<br />
different spectrum analyzers.<br />
Some of the specifications, such as frequency response, are frequency-range<br />
dependent. A 3 GHz RF analyzer might have a frequency response of ±0.38 dB,<br />
while a microwave spectrum analyzer tuning in the 26 GHz range could have<br />
a frequency response of ±2.5 dB or higher. On the other hand, other sources<br />
of uncertainty, such as changing resolution bandwidths, apply equally to<br />
all frequencies.<br />
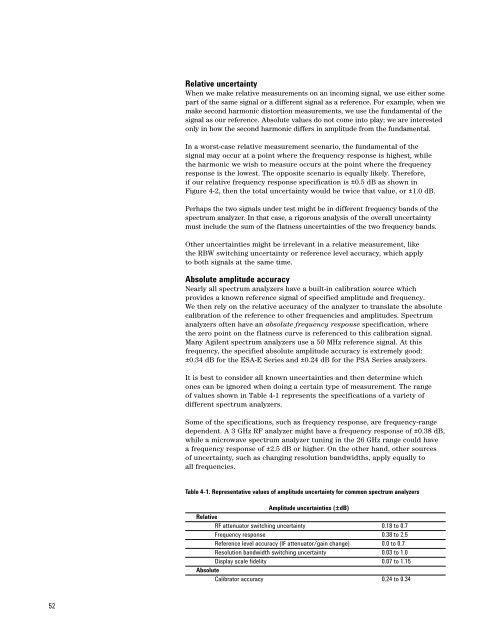
Table 4-1. Representative values of amplitude uncertainty for common spectrum analyzers<br />
Amplitude uncertainties (±dB)<br />
Relative<br />
RF attenuator switching uncertainty 0.18 to 0.7<br />
Frequency response 0.38 to 2.5<br />
Reference level accuracy (IF attenuator/gain change) 0.0 to 0.7<br />
Resolution bandwidth switching uncertainty 0.03 to 1.0<br />
Display scale fidelity 0.07 to 1.15<br />
Absolute<br />
Calibrator accuracy 0.24 to 0.34<br />
52


