

Agilent Spectrum Analysis Basics - Agilent Technologies
Agilent Spectrum Analysis Basics - Agilent Technologies
Agilent Spectrum Analysis Basics - Agilent Technologies

You also want an ePaper? Increase the reach of your titles
YUMPU automatically turns print PDFs into web optimized ePapers that Google loves.
Since the output of a spectrum analyzer is an X-Y trace on a display, let’s see<br />
what information we get from it. The display is mapped on a grid (graticule)<br />
with ten major horizontal divisions and generally ten major vertical divisions.<br />
The horizontal axis is linearly calibrated in frequency that increases from<br />
left to right. Setting the frequency is a two-step process. First we adjust the<br />
frequency at the centerline of the graticule with the center frequency control.<br />
Then we adjust the frequency range (span) across the full ten divisions with<br />
the Frequency Span control. These controls are independent, so if we change<br />
the center frequency, we do not alter the frequency span. Alternatively, we<br />
can set the start and stop frequencies instead of setting center frequency and<br />
span. In either case, we can determine the absolute frequency of any signal<br />
displayed and the relative frequency difference between any two signals.<br />
The vertical axis is calibrated in amplitude. We have the choice of a linear<br />
scale calibrated in volts or a logarithmic scale calibrated in dB. The log scale<br />
is used far more often than the linear scale because it has a much wider<br />
usable range. The log scale allows signals as far apart in amplitude as 70 to<br />
100 dB (voltage ratios of 3200 to 100,000 and power ratios of 10,000,000 to<br />
10,000,000,000) to be displayed simultaneously. On the other hand, the linear<br />
scale is usable for signals differing by no more than 20 to 30 dB (voltage ratios<br />
of 10 to 32). In either case, we give the top line of the graticule, the reference<br />
level, an absolute value through calibration techniques 1 and use the scaling<br />
per division to assign values to other locations on the graticule. Therefore,<br />
we can measure either the absolute value of a signal or the relative amplitude<br />
difference between any two signals.<br />
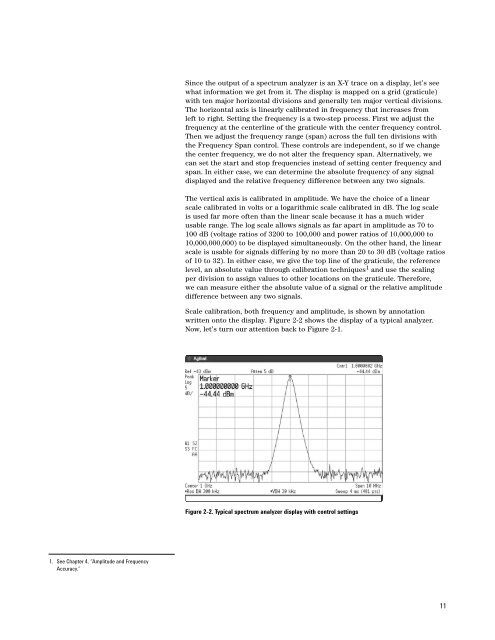
Scale calibration, both frequency and amplitude, is shown by annotation<br />
written onto the display. Figure 2-2 shows the display of a typical analyzer.<br />
Now, let’s turn our attention back to Figure 2-1.<br />
Figure 2-2. Typical spectrum analyzer display with control settings<br />
1. See Chapter 4, “Amplitude and Frequency<br />
Accuracy.”<br />
11


