

Agilent Spectrum Analysis Basics - Agilent Technologies
Agilent Spectrum Analysis Basics - Agilent Technologies
Agilent Spectrum Analysis Basics - Agilent Technologies

Create successful ePaper yourself
Turn your PDF publications into a flip-book with our unique Google optimized e-Paper software.
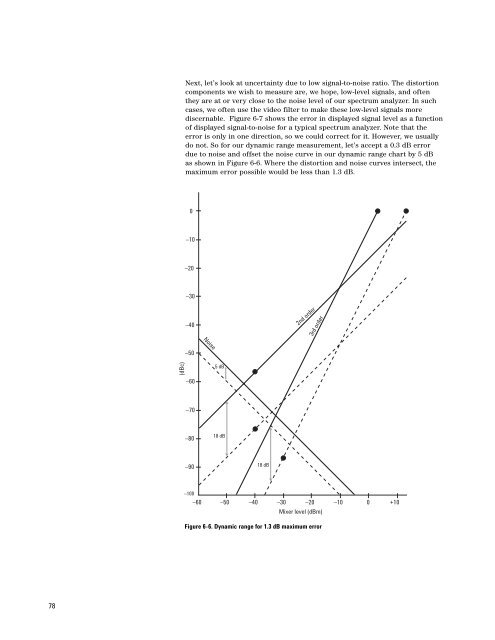
Next, let’s look at uncertainty due to low signal-to-noise ratio. The distortion<br />
components we wish to measure are, we hope, low-level signals, and often<br />
they are at or very close to the noise level of our spectrum analyzer. In such<br />
cases, we often use the video filter to make these low-level signals more<br />
discernable. Figure 6-7 shows the error in displayed signal level as a function<br />
of displayed signal-to-noise for a typical spectrum analyzer. Note that the<br />
error is only in one direction, so we could correct for it. However, we usually<br />
do not. So for our dynamic range measurement, let’s accept a 0.3 dB error<br />
due to noise and offset the noise curve in our dynamic range chart by 5 dB<br />
as shown in Figure 6-6. Where the distortion and noise curves intersect, the<br />
maximum error possible would be less than 1.3 dB.<br />
0<br />
–10<br />
–20<br />
–30<br />
–40<br />
2nd order<br />
3rd order<br />
Noise<br />
–50<br />
(dBc)<br />
–60<br />
5 dB<br />
–70<br />
–80<br />
18 dB<br />
–90<br />
18 dB<br />
–100<br />
–60 –50 –40 –30 –20 –10 0 +10<br />
Mixer level (dBm)<br />
Figure 6-6. Dynamic range for 1.3 dB maximum error<br />
78


