

Agilent Spectrum Analysis Basics - Agilent Technologies
Agilent Spectrum Analysis Basics - Agilent Technologies
Agilent Spectrum Analysis Basics - Agilent Technologies

Create successful ePaper yourself
Turn your PDF publications into a flip-book with our unique Google optimized e-Paper software.
In Chapter 2, we did a filter skirt selectivity calculation for two signals<br />
spaced 4 kHz apart, using a 3 kHz analog filter. Let’s repeat that calculation<br />
using digital filters. A good model of the selectivity of digital filters is a<br />
near-Gaussian model:<br />
∆f<br />
H(∆f) = –3.01 dB x [ ] α<br />
RBW/2<br />
where<br />
H(∆f) is the filter skirt rejection in dB<br />
∆f is the frequency offset from the center in Hz, and<br />
α is a parameter that controls selectivity. α = 2 for an ideal<br />
Gaussian filter. The swept RBW filters used in <strong>Agilent</strong><br />
spectrum analyzers are based on a near-Gaussian model with an α<br />
value equal to 2.12, resulting in a selectivity ratio of 4.1:1.<br />
Entering the values from our example into the equation, we get:<br />
H(4 kHz) = –3.01 dB x [ 4000 ] 2.12<br />
3000/2<br />
= –24.1 dB<br />
At an offset of 4 kHz, the 3 kHz digital filter is down –24.1 dB compared<br />
to the analog filter which was only down –14.8 dB. Because of its superior<br />
selectivity, the digital filter can resolve more closely spaced signals.<br />
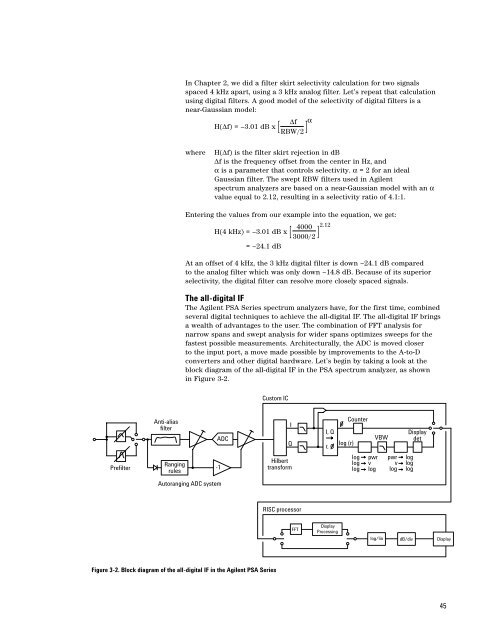
The all-digital IF<br />
The <strong>Agilent</strong> PSA Series spectrum analyzers have, for the first time, combined<br />
several digital techniques to achieve the all-digital IF. The all-digital IF brings<br />
a wealth of advantages to the user. The combination of FFT analysis for<br />
narrow spans and swept analysis for wider spans optimizes sweeps for the<br />
fastest possible measurements. Architecturally, the ADC is moved closer<br />
to the input port, a move made possible by improvements to the A-to-D<br />
converters and other digital hardware. Let’s begin by taking a look at the<br />
block diagram of the all-digital IF in the PSA spectrum analyzer, as shown<br />
in Figure 3-2.<br />
Custom IC<br />
Anti-alias<br />
filter<br />
ADC<br />
I<br />
Q<br />
I, Q<br />
r,<br />
log (r)<br />
Counter<br />
VBW<br />
Display<br />
det<br />
Prefilter<br />
Ranging<br />
rules<br />
-1<br />
Hilbert<br />
transform<br />
log<br />
log<br />
log<br />
pwr<br />
v<br />
log<br />
pwr<br />
v<br />
log<br />
log<br />
log<br />
log<br />
Autoranging ADC system<br />
RISC processor<br />
FFT<br />
Display<br />
Processing<br />
log/lin<br />
dB/div<br />
Display<br />
Figure 3-2. Block diagram of the all-digital IF in the <strong>Agilent</strong> PSA Series<br />
45


