- Page 1 and 2:
R E S E A R C H R E P O R T M A R C
- Page 3 and 4:
Table of Contents Executive Summary
- Page 5 and 6:
Introduction and Review of the Lite
- Page 7 and 8:
Market Changes ....................
- Page 9 and 10:
Appendix G ........................
- Page 11 and 12: Main Findings We highlight 17 main
- Page 13 and 14: 6. For offenders, the prevalence of
- Page 15 and 16: Chapter 1 Introduction Purpose of t
- Page 17 and 18: information about populations that
- Page 19 and 20: In chapters three through eight, we
- Page 21 and 22: seven sites were finalized in June
- Page 23 and 24: individuals we wanted to interview.
- Page 25 and 26: a total of 142 sex traffickers/pimp
- Page 27 and 28: using interview data for the relati
- Page 29 and 30: Table 2.2 Proxy Variables Dataset V
- Page 31 and 32: Chapter 3 Methodology and Derivatio
- Page 33 and 34: We also looked to estimates of the
- Page 35 and 36: In this work, the LoCC will be invo
- Page 37 and 38: 1.2.1. Linear Proxy We say that a v
- Page 39 and 40: Table 3.2 Number of Sex Proxy ( ) R
- Page 41 and 42: direct estimation method applied to
- Page 43 and 44: in column 3 of the table below. The
- Page 45 and 46: 1.2.4. Linear Proxy We followed the
- Page 47 and 48: 1.4. The Linear Program 1.4.1. Sex
- Page 49 and 50: Table 3.12 Cross-City Sex Proxy Rat
- Page 51 and 52: Note that the entries in the tables
- Page 53 and 54: Note that the entries in the tables
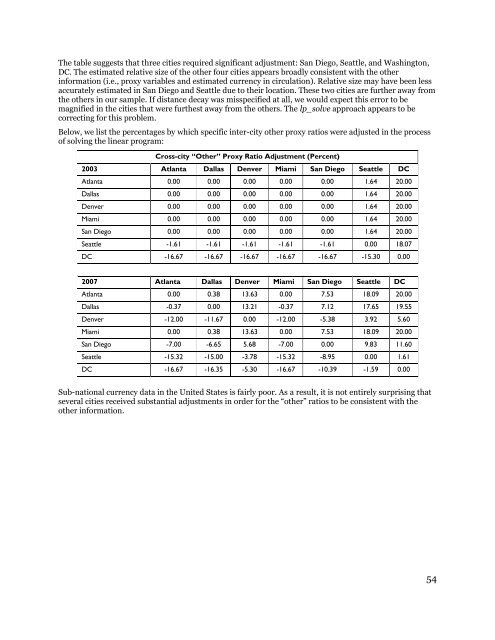
- Page 55 and 56: Note that the entries in the tables
- Page 57 and 58: 1.4.7. Techniques for Solving the L
- Page 59 and 60: Where the above table shows actual
- Page 61: 1.6.3. Guns Economy Rankings Here w
- Page 65 and 66: Chapter 4 Stakeholder Perspectives
- Page 67 and 68: Main Findings from this Chapter Inc
- Page 69 and 70: Brothels Law enforcement reported t
- Page 71 and 72: The other thing we do have is in th
- Page 73 and 74: Dallas, Texas Fifteen individuals w
- Page 75 and 76: Table 4.2. Continued Erotic massage
- Page 77 and 78: that we’ve done because when we
- Page 79 and 80: Although African American men compr
- Page 81 and 82: I think what we are really talking
- Page 83 and 84: actually go to them to find you wha
- Page 85 and 86: Truckers The underground commercial
- Page 87 and 88: Street and Internet Similar to othe
- Page 89 and 90: Street/Internet-based pimps are net
- Page 91 and 92: Figure 4.4 Erotic Massage Parlors i
- Page 93 and 94: promising sign that law enforcement
- Page 95 and 96: On the Latino brothel front we foun
- Page 97 and 98: Street Street-based commercial sex
- Page 99 and 100: majority of prostitutes. That does
- Page 101 and 102: potential paper trail. Money was re
- Page 103 and 104: Kansas City, Missouri Sixteen indiv
- Page 105 and 106: Internet and Street Similar to what
- Page 107 and 108: Pimps have always been mobile, movi
- Page 109 and 110: San Diego, California Eighteen indi
- Page 111 and 112: Street and Internet Similar to the
- Page 113 and 114:
are not documented by the police as
- Page 115 and 116:
always look for the most vulnerable
- Page 117 and 118:
hotels in their name … they have
- Page 119 and 120:
eliminated from having to follow a
- Page 121 and 122:
the room is, so it a three bedroom
- Page 123 and 124:
Street and Internet Seattle, like m
- Page 125 and 126:
Most of the gang members involved i
- Page 127 and 128:
Erotic Massage Parlors and Spas The
- Page 129 and 130:
getting a ticket in Lynnwood for no
- Page 131 and 132:
Table 4.8 Stakeholder Perceptions o
- Page 133 and 134:
need to be followed and pimps opera
- Page 135 and 136:
Erotic Massage Parlors Another prim
- Page 137 and 138:
typically between the ages of 16 an
- Page 139 and 140:
Chapter 5 Identity, Entry, and Risk
- Page 141 and 142:
Respondent Demographics Respondents
- Page 143 and 144:
presence of pimping in music and it
- Page 145 and 146:
Respondents distinguished between d
- Page 147 and 148:
Figure 5.5 Family Member Involvemen
- Page 149 and 150:
Multiple factors related to neighbo
- Page 151 and 152:
wanted me to know. She fed me the g
- Page 153 and 154:
mom. I wanted to go about it a diff
- Page 155 and 156:
Hiding Behind Legal Businesses Lega
- Page 157 and 158:
Another female interviewee, serving
- Page 159 and 160:
Chapter 6 Networks, Relationships,
- Page 161 and 162:
Actors in the Underground Sex Marke
- Page 163 and 164:
everything. I collected the money,
- Page 165 and 166:
they’ve made enough. That’s wha
- Page 167 and 168:
eally nice—not whorish—I’d ha
- Page 169 and 170:
Respondent: Right. I got a friend,
- Page 171 and 172:
affording a fancy lifestyle. Offend
- Page 173 and 174:
Figure 6.1 Recruitment Venues Neigh
- Page 175 and 176:
e escaping one life or seeking anot
- Page 177 and 178:
Mutual Dependency We are going to t
- Page 179 and 180:
money. I took care of who took care
- Page 181 and 182:
Rules One bad girl can knock your w
- Page 183 and 184:
Reasons for restrictions varied, bu
- Page 185 and 186:
encourage his employees to make mon
- Page 187 and 188:
have sex with each other when a con
- Page 189 and 190:
Competition Between Employees We ca
- Page 191 and 192:
little partner pull a gun on me. I
- Page 193 and 194:
Beyond employees, pimps shared othe
- Page 195 and 196:
pimp reported, “Usually you stay
- Page 197 and 198:
(D13). Another respondent reported
- Page 199 and 200:
Chapter 7 Business Practices and Op
- Page 201 and 202:
7.1 presents the percentage of resp
- Page 203 and 204:
eported the costs of maintaining he
- Page 205 and 206:
hour special. In-calls only.” You
- Page 207 and 208:
used because respondents feared tha
- Page 209 and 210:
Rates and Pricing Structures Rates
- Page 211 and 212:
One respondent explained the evolut
- Page 213 and 214:
Finally, respondents also charged d
- Page 215 and 216:
transactions completed were in-call
- Page 217 and 218:
associated with their charges, thou
- Page 219 and 220:
Changes in the Field The field does
- Page 221 and 222:
“Years ago, a john, a certain guy
- Page 223 and 224:
connected through the same gang. Th
- Page 225 and 226:
Main Findings from this Chapter Inc
- Page 227 and 228:
clients, served as a coping mechani
- Page 229 and 230:
Respondents worked in five of the e
- Page 231 and 232:
gays being together, men treating t
- Page 233 and 234:
multitude of environments including
- Page 235 and 236:
Rates, Expenses, and Spending Those
- Page 237 and 238:
individuals in their social network
- Page 239 and 240:
The Makeup and Conditions of the St
- Page 241 and 242:
Interviewer: You mentioned that wha
- Page 243 and 244:
Interviewer: And was that in cash o
- Page 245 and 246:
Demand, Clients, and Establishing D
- Page 247 and 248:
new venue to solicit sex work. A mo
- Page 249 and 250:
Respondent: Yeah, illegal. They mak
- Page 251 and 252:
explained, “A lot of guys would g
- Page 253 and 254:
Substances Participants felt that t
- Page 255 and 256:
A number of sex workers were caught
- Page 257 and 258:
I hear [other sex workers] talking
- Page 259 and 260:
while another respondent described
- Page 261 and 262:
the genital regions of clothed chil
- Page 263 and 264:
Recent studies (Merdian et al. 2013
- Page 265 and 266:
Technology It is widely accepted th
- Page 267 and 268:
Deep Web There is big problem that
- Page 269 and 270:
One offender acknowledged that purc
- Page 271 and 272:
The sample was almost evenly split
- Page 273 and 274:
One offender believed he knew what
- Page 275 and 276:
particular series When did this com
- Page 277 and 278:
One guy hacked into my computer one
- Page 279 and 280:
Production Location When asked wher
- Page 281 and 282:
availability, affordability, and an
- Page 283 and 284:
and eventually, it works its way to
- Page 285 and 286:
Law enforcement said they were able
- Page 287 and 288:
A national or international nexus w
- Page 289 and 290:
Table 10.1 Estimates of Illicit Mar
- Page 291 and 292:
Law enforcement noted that travel c
- Page 293 and 294:
in public venues, utilized their ow
- Page 295 and 296:
Pimps who were aware of the penalti
- Page 297 and 298:
Practice Implications Investigative
- Page 299 and 300:
Policy Implications As the above fi
- Page 301 and 302:
Finding 6: For offenders, the preva
- Page 303 and 304:
child pornography. More research ne
- Page 305 and 306:
Cooper, Bo. 2002. “New Approach t
- Page 307 and 308:
McMillan, John, and Pablo Zoido. 20
- Page 309 and 310:
US Department of Justice. 2010. The
- Page 311 and 312:
Appendix B Screening Interview Ques
- Page 313 and 314:
1. How many UCS cases has your agen
- Page 315 and 316:
8. How has the UCSE changed in rece
- Page 317 and 318:
If you have any additional question
- Page 319 and 320:
18:2421 Transportation generally 18
- Page 321 and 322:
these case reviews as supplementing
- Page 323 and 324:
Point-person designation The person
- Page 325 and 326:
Voluntary Participation: You may re
- Page 327 and 328:
Part I: Background information 1. W
- Page 329 and 330:
Part II: Specific Case Questions (P
- Page 331 and 332:
a. If yes, how did you learn about
- Page 333 and 334:
Part I: Background information 46.
- Page 335 and 336:
70. Are there any differences in th
- Page 337 and 338:
89. Are you aware of the prosecutor
- Page 339 and 340:
19. Who did what How was that decid
- Page 341 and 342:
Technology Questions These question
- Page 343 and 344:
discuss new or unprosecuted crimina
- Page 345 and 346:
Voluntary Participation. You may re
- Page 347 and 348:
Appendix L Terminology Blade: A pub