2012 Annual Report - Media Prima Berhad
2012 Annual Report - Media Prima Berhad
2012 Annual Report - Media Prima Berhad

Create successful ePaper yourself
Turn your PDF publications into a flip-book with our unique Google optimized e-Paper software.
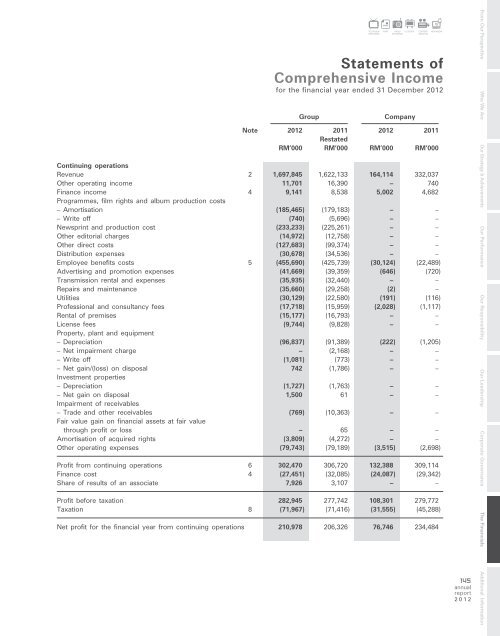
Group<br />
RADIO OUTDOOR<br />
NETWORKS<br />
Company<br />
Note <strong>2012</strong> 2011 <strong>2012</strong> 2011<br />
Restated<br />
RM’000 RM’000 RM’000 RM’000<br />
Continuing operations<br />
Revenue 2 1,697,845 1,622,133 164,114 332,037<br />
Other operating income 11,701 16,390 – 740<br />
Finance income 4 9,141 8,538 5,002 4,682<br />
Programmes, film rights and album production costs<br />
– Amortisation (185,465) (179,183) – –<br />
– Write off (740) (5,696) – –<br />
Newsprint and production cost (233,233) (225,261) – –<br />
Other editorial charges (14,972) (12,758) – –<br />
Other direct costs (127,683) (99,374) – –<br />
Distribution expenses (30,678) (34,536) – –<br />
Employee benefits costs 5 (455,690) (425,739) (30,124) (22,489)<br />
Advertising and promotion expenses (41,669) (39,359) (646) (720)<br />
Transmission rental and expenses (35,935) (32,440) – –<br />
Repairs and maintenance (35,660) (29,258) (2) –<br />
Utilities (30,129) (22,580) (191) (116)<br />
Professional and consultancy fees (17,718) (15,959) (2,028) (1,117)<br />
Rental of premises (15,177) (16,793) – –<br />
License fees (9,744) (9,828) – –<br />
Property, plant and equipment<br />
– Depreciation (96,837) (91,389) (222) (1,205)<br />
– Net impairment charge – (2,168) – –<br />
– Write off (1,081) (773) – –<br />
– Net gain/(loss) on disposal 742 (1,786) – –<br />
Investment properties<br />
– Depreciation (1,727) (1,763) – –<br />
– Net gain on disposal 1,500 61 – –<br />
Impairment of receivables<br />
– Trade and other receivables (769) (10,363) – –<br />
Fair value gain on financial assets at fair value<br />
through profit or loss – 65 – –<br />
Amortisation of acquired rights (3,809) (4,272) – –<br />
Other operating expenses (79,743) (79,189) (3,515) (2,698)<br />
Profit from continuing operations 6 302,470 306,720 132,388 309,114<br />
Finance cost 4 (27,451) (32,085) (24,087) (29,342)<br />
Share of results of an associate 7,926 3,107 – –<br />
Profit before taxation 282,945 277,742 108,301 279,772<br />
Taxation 8 (71,967) (71,416) (31,555) (45,288)<br />
Net profit for the financial year from continuing operations 210,978 206,326 76,746 234,484<br />
TELEVISION<br />
NETWORKS<br />
CONTENT<br />
CREATION<br />
NEW MEDIA<br />
Statements of<br />
Comprehensive Income<br />
for the financial year ended 31 December <strong>2012</strong><br />
PRINT<br />
145<br />
annual<br />
report<br />
<strong>2012</strong><br />
From Our Perspective Who We Are Our Strategy & Achievements Our Performance Our Responsibility Our Leadership Corporate Governance The Financials Additional Information