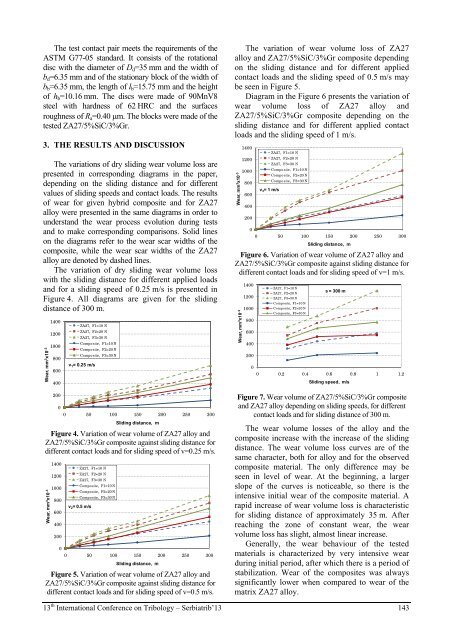
- Page 1 and 2:
SerbianTribologySocietyFacultyofEng
- Page 3 and 4:
Serbian Tribology SocietyUniversity
- Page 5 and 6:
Supported byMinistry of Education,
- Page 7 and 8:
PrefaceThe International Conference
- Page 9 and 10:
ContentsPlenary Lectures1. THE GREE
- Page 11 and 12:
27. WEAR CHARACTERISTICS OF HYBRID
- Page 13 and 14:
Tribometry57. PRELIMINARY STUDY ON
- Page 15:
Plenary Lectures13 th International
- Page 18 and 19:
Serbian TribologySocietySERBIATRIB
- Page 20 and 21:
Figure 4. Diagram of the height and
- Page 22 and 23:
Realization of the approach is base
- Page 24 and 25:
Serbian TribologySocietySERBIATRIB
- Page 27 and 28:
Serbian TribologySocietySERBIATRIB
- Page 29 and 30:
edge without chamfer and smaller ra
- Page 31 and 32:
Figure 7. Accumulated tool life in
- Page 33 and 34:
Figure 13. Calculated and measured
- Page 35 and 36:
Serbian TribologySocietySERBIATRIB
- Page 37 and 38:
Friction deformation of the bronze
- Page 39 and 40:
engine cylinders of 2-cylinder-twot
- Page 41 and 42:
Table 1: Chemical composition of sa
- Page 43 and 44:
Table 4: Comparative wear-resistanc
- Page 45 and 46:
Serbian TribologySocietySERBIATRIB
- Page 47 and 48:
- measuring of coating thickness h
- Page 49 and 50:
Figure 5. Functional scheme of the
- Page 51 and 52:
Serbian TribologySocietySERBIATRIB
- Page 53 and 54:
Table 2. Test results for massive w
- Page 55 and 56:
knowledge transfer in the field ofm
- Page 57 and 58:
Table 1. Parameters of the electroc
- Page 59 and 60:
Figure 6. Wear resistance by linear
- Page 61 and 62:
coatings and observed their good we
- Page 63 and 64:
c)a)Figure 2: SEM images and micros
- Page 65 and 66:
Room temperature 300°CNi/µSiCNiNi
- Page 67 and 68:
COF [-] COF [-]Fig.9: COF graphs at
- Page 69 and 70:
Serbian TribologySocietySERBIATRIB
- Page 71 and 72:
about 260 nm is related to isolated
- Page 73 and 74:
contact’s conformity [18] they ob
- Page 75 and 76:
In order to calculate the metallic
- Page 77 and 78:
microscopic inspection of the Rp3 s
- Page 79 and 80:
Serbian TribologySocietySERBIATRIB
- Page 81 and 82:
otating plate. The shaft passes thr
- Page 83 and 84:
similar trends of variation are obs
- Page 85 and 86:
smooth, gear fiber-mild steel rough
- Page 87 and 88:
[2] Tabor, D.: “Friction and wear
- Page 89 and 90:
Serbian TribologySocietySERBIATRIB
- Page 91 and 92:
(10, 50 and 100 N) against surface
- Page 93 and 94:
[9] B.R. Gligorijevic, A. Vencl, B.
- Page 95 and 96:
dielectric properties, high resista
- Page 97 and 98:
parameter, Sv, was slightly influen
- Page 99 and 100:
dependence of roughness height and
- Page 101 and 102:
Serbian TribologySocietySERBIATRIB
- Page 103 and 104:
Polyethylenes with a molecular weig
- Page 105 and 106: [9] K.S. Kanaga Karuppiah, A.L. Bru
- Page 107 and 108: MgCO3•CaCO3 (13% Mg), and carnall
- Page 109 and 110: fully compatible with MRI/MSCT imag
- Page 111 and 112: 5. CONCLUSIONThe magnesium alloys a
- Page 113 and 114: Zinc dialkyldithiophosphate (ZDDP)
- Page 115 and 116: C- Lower deposits with NPNA on comb
- Page 117 and 118: films. Carraro et al. [10] examined
- Page 119 and 120: PlateCount No.Critical Load ( N)120
- Page 121 and 122: solid melt of ZA27 alloy using mech
- Page 123 and 124: SiC particles are uniformly distrib
- Page 125 and 126: in number of micro-cracks and clust
- Page 127 and 128: Serbian TribologySocietySERBIATRIB
- Page 129 and 130: PBT has the average values of the f
- Page 131 and 132: mechanical pressure and thermal loa
- Page 133 and 134: Serbian TribologySocietySERBIATRIB
- Page 135 and 136: 3. EXPERIMENTAL RESULTSTaking into
- Page 137 and 138: [12] L. Blunt De, X. Jiang: Advance
- Page 139 and 140: 2. EXPERIMENTALTESTING2.1 MaterialT
- Page 141 and 142: figure 3a it could be seen that the
- Page 143 and 144: Serbian TribologySocietySERBIATRIB
- Page 145 and 146: and lubrication is done so that the
- Page 147 and 148: 5. CONCLUSIONFigure 11. The accumul
- Page 149 and 150: Serbian TribologySocietySERBIATRIB
- Page 151 and 152: esistance was found for composite c
- Page 153 and 154: onze, which is embedded within the
- Page 155: Serbian TribologySocietySERBIATRIB
- Page 159 and 160: complete. The SEM analysis maycontr
- Page 161 and 162: Serbian TribologySocietySERBIATRIB
- Page 163 and 164: tg( ) tg 100, [%] (2)tgwhere are:
- Page 165 and 166: corresponding to the maximum value
- Page 167 and 168: Serbian TribologySocietySERBIATRIB
- Page 169 and 170: electrostatics [17]. Due to the fle
- Page 171 and 172: 250nm size have been observed, acco
- Page 173 and 174: ETH Zurich, Switzerland, where all
- Page 175 and 176: comparison with the synthetic reinf
- Page 177 and 178: 3. RESULTS AND DISCUSSION3.1 Micros
- Page 179 and 180: (a)(b)Figure 4. Showing (a) variati
- Page 181 and 182: composites. But the composite compo
- Page 183 and 184: Serbian TribologySocietySERBIATRIB
- Page 185 and 186: coated and uncoated region after ad
- Page 187 and 188: has been measured between the top s
- Page 189 and 190: Fig. 9 shows the wear track obtaine
- Page 191 and 192: Serbian TribologySocietySERBIATRIB
- Page 193 and 194: Mica samples preparationFor the ads
- Page 195 and 196: According to the AFM results in fig
- Page 197 and 198: [21] B. G. Sharma et al.: Character
- Page 199 and 200: chemical vapor deposition method wi
- Page 201 and 202: analysis (a) and an approximate che
- Page 203 and 204: Table 3. Friction coefficients of s
- Page 205: A.K.Oleynik, V.M.Matsevity, ea.]. /
- Page 209 and 210:
Serbian TribologySocietySERBIATRIB
- Page 211 and 212:
Most of the friction units of produ
- Page 213 and 214:
In order to provide both high parts
- Page 215 and 216:
Fig. 3. The comparison the criterio
- Page 217 and 218:
Table 3. Experimental and calculate
- Page 219 and 220:
For developing the numerical model
- Page 221 and 222:
,eccentricities and hydrodynamic pr
- Page 223 and 224:
hydrodynamic regime. However, for b
- Page 225 and 226:
to obtain the temperature distribut
- Page 227 and 228:
force (pressure) between two contac
- Page 229 and 230:
5E-06The total displacement [m]4.5E
- Page 231 and 232:
Serbian TribologySocietySERBIATRIB
- Page 233 and 234:
[11]. Figure 5 shows s the influenc
- Page 235 and 236:
efficiency of use, product quality,
- Page 237 and 238:
38GSA. The chemical composition, de
- Page 239 and 240:
niobium. It should be noted that fo
- Page 241 and 242:
Figure 1. Friction force on side su
- Page 243 and 244:
exploitation this changing is signi
- Page 245 and 246:
2. EFFICIENCY OF CYCLO DRIVEEfficie
- Page 247 and 248:
Figure 6. Dependence of cyclo drive
- Page 249 and 250:
common for their ability to be inst
- Page 251 and 252:
FNF (11)R sin cos11 21 22FNF
- Page 253 and 254:
Normal force [N]4000350030002500200
- Page 255 and 256:
analytical tests. The analytical te
- Page 257 and 258:
Table 4. Results of zero samples of
- Page 259 and 260:
noticeable, and by the end of explo
- Page 261 and 262:
Serbian TribologySocietySERBIATRIB
- Page 263 and 264:
4. PLASTIC BEARING APPLICATIONSRega
- Page 265 and 266:
Serbian TribologySocietySERBIATRIB
- Page 267 and 268:
For Elastohydrodynamic film thickne
- Page 269 and 270:
The results concluded for different
- Page 271 and 272:
For Thrust Force of 40KNKrytox 215
- Page 273 and 274:
Krytox 215 (µ = 0.03204 Pa.s)Figur
- Page 275 and 276:
Serbian TribologySocietySERBIATRIB
- Page 277 and 278:
- Reliable exploitation tools, prim
- Page 279 and 280:
Serbian TribologySocietySERBIATRIB
- Page 281 and 282:
In addition, as a result of cyclic
- Page 283 and 284:
AcknowledgementThe part of this res
- Page 285 and 286:
Thepressure angle can be calculated
- Page 287 and 288:
mechanism these parameters are fina
- Page 289 and 290:
Serbian TribologySocietySERBIATRIB
- Page 291 and 292:
causes big changes of their propert
- Page 293 and 294:
Table 2. Impact toughness of some t
- Page 295 and 296:
Serbian TribologySocietySERBIATRIB
- Page 297 and 298:
Figure 1. Appearance of fractured f
- Page 299 and 300:
implementation of these new manugac
- Page 301 and 302:
additional energy is dissipated due
- Page 303 and 304:
The adopted geometry parameters are
- Page 305 and 306:
4. CONCLUSIONTools of virtual produ
- Page 307 and 308:
Figure 2. Structure of the machinin
- Page 309 and 310:
3. ANALYSIS OF RESULTSThe results o
- Page 311 and 312:
Figure 15. Surface roughness regard
- Page 313 and 314:
From the analysis of the diagram it
- Page 315 and 316:
comparison from economic, energy co
- Page 317 and 318:
Advantages and disadvantages of tra
- Page 319 and 320:
The information provided by footwea
- Page 321 and 322:
Force (N)5,554,543,532,521,510,50Ex
- Page 323 and 324:
additives, that had been, until rec
- Page 325 and 326:
Figure 1. Test results for samples
- Page 327 and 328:
Table 7. Test results of oil sample
- Page 329 and 330:
Input parameters- Current intensity
- Page 331 and 332:
edge formed into a thin line. At th
- Page 333 and 334:
Lower values of current are not res
- Page 335 and 336:
Table 1. Chemical composition of si
- Page 337 and 338:
flowable at high temperatures and v
- Page 339 and 340:
holes (pits) emerge in the shape of
- Page 341:
[4] W. Schatt, K-P. Wieters, Pulver
- Page 345 and 346:
Serbian TribologySocietySERBIATRIB
- Page 347 and 348:
assumption allows us to use, instea
- Page 349 and 350:
where P is the load, a - radius of
- Page 351 and 352:
determination (total running in tim
- Page 353 and 354:
μm, compared with Figure 17, wich
- Page 355 and 356:
Serbian TribologySocietySERBIIATRIB
- Page 357 and 358:
Especially when the chain transfer
- Page 359 and 360:
is obvious that this isa so-calledw
- Page 361 and 362:
winches. The authors are inclined t
- Page 363 and 364:
find parameters of robot laser hard
- Page 365 and 366:
Serbian TribologySocietySERBIATRIB
- Page 367 and 368:
each of which is measured by the le
- Page 369 and 370:
Serbian TribologySocietySERBIATRIB
- Page 371 and 372:
Fractal dimensions were determined
- Page 373 and 374:
Serbian TribologySocietySERBIATRIB
- Page 375 and 376:
Figure 3. Modified force acting sch
- Page 377 and 378:
0.25Lubricant: L3DC 04Friction coef
- Page 379 and 380:
nanocomposites. The influence of fi
- Page 381 and 382:
4. RESULTS AND DISCUSSION4.1 Morpho
- Page 383 and 384:
Figure 6. Loading and unloadin vers
- Page 385 and 386:
3 8 12 1 4 2 4
- Page 387 and 388:
Serbian TribologySocietySERBIATRIB
- Page 389 and 390:
The material after qualifying the r
- Page 391 and 392:
It has already been mentioned that
- Page 393 and 394:
Degradation & Stability, Vol. 69, N
- Page 395 and 396:
conformance to researchers’ requi
- Page 397 and 398:
This part is assembled of pneumatic
- Page 399 and 400:
matrixes describe the state of the
- Page 401 and 402:
values influence of themeasurement
- Page 403 and 404:
Figure 1. Friction stir weldinga -
- Page 405 and 406:
(t 2 t
- Page 407 and 408:
M fr / T [-] [-]10.90.80.70.60.50.4
- Page 409 and 410:
M fr / T [-]10.90.80.70.60.50.40.30
- Page 411 and 412:
experimentally determined that for
- Page 413 and 414:
4. DISCUSSIONAccording to the theor
- Page 415 and 416:
Serbian TribologySocietySERBIATRIB
- Page 417 and 418:
2.1 The life cycle of the reportThe
- Page 419:
Obviously the report is checked and
- Page 423 and 424:
Serbian TribologySocietySERBIATRIB
- Page 425 and 426:
uticaja na osnovu kompozita, a time
- Page 427 and 428:
5. ZAKLJUČCIStruktura tiksolivene
- Page 429 and 430:
dobijene različite karakteristike
- Page 431 and 432:
vizuelno, na dnevnoj svetlosti, pod
- Page 433 and 434:
LITERATURA[1] Зинченко В.
- Page 435 and 436:
Slika 1. Rotorni bager - glodar VII
- Page 437 and 438:
stvaraju sliku stanja i svoja zapa
- Page 439 and 440:
njihovih kotrljanih elemenata. Mere
- Page 441 and 442:
postupka i uticaja parametara depoz
- Page 443 and 444:
posledica različite raspodele mikr
- Page 445 and 446:
ZrO 2 Y 2 O 3 je takođe zbog oksid
- Page 447 and 448:
Serbian TribologySocietySERBIATRIB
- Page 449 and 450:
3.2 Pneumatska osetljivostOblast pr
- Page 451 and 452:
p mg (δ), koji je zbog malih struj
- Page 453 and 454:
PNEUMATIC PROBE HEAD SELECTION FOR
- Page 455 and 456:
1. Podsistem kopanja2. Podsistem pr
- Page 457 and 458:
Slika 3. Kriva habanjaNa tom dijagr
- Page 459 and 460:
Mjereni su parametri habanja i pril
- Page 461 and 462:
preše prevladavaju kombinirani uvj
- Page 463 and 464:
a) b)Slika 5. Karakteristična mikr
- Page 465:
varijantnih materijala u dostavnom
- Page 468 and 469:
Jovanović D. 414, 446KKaleicheva J
- Page 470 and 471:
CIP - Каталогизација


