Engineering
Engineering
Engineering

Create successful ePaper yourself
Turn your PDF publications into a flip-book with our unique Google optimized e-Paper software.
2.5 Management report on on the Group Non-financial performance indicators indicators<br />
The Group’s workforce grew outside<br />
Germany in 2010/2011 and declined<br />
slightly in Germany.<br />
Reporting in prior years related to the costs of basic research and development comprising non-capitalized<br />
research and development costs and capitalized development costs. With immediate effect we will report<br />
only on expenditure recognized in the reporting period, i.e. the non-capitalized research and development<br />
costs including amortization of capitalized development costs as well as order-related development costs.<br />
The prior-year comparatives for order-related development costs have been adjusted. Expenditure for<br />
technical quality assurance is no longer included.<br />
Research and development expenditure in million €<br />
2009/2010 2010/2011<br />
96<br />
Change<br />
in %<br />
Non-capitalized research and development costs 191 188 (2)<br />
Amortization of capitalized development costs 33 39 18<br />
Order-related development costs* 218 297 36<br />
Total 442 524 19<br />
* Part of cost of sales without offsetting grants/subsidies<br />
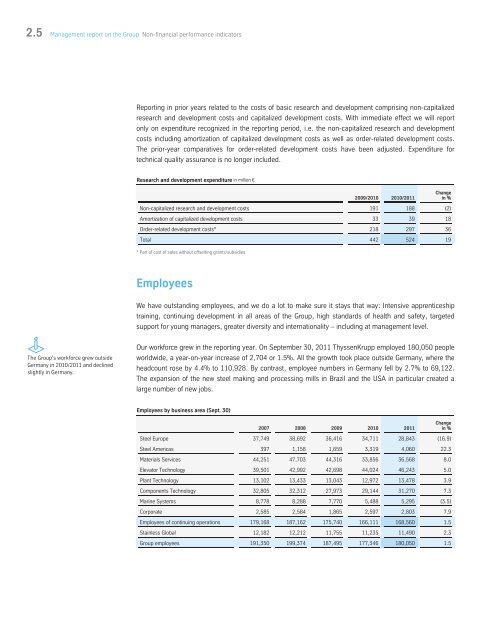
Employees<br />
We have outstanding employees, and we do a lot to make sure it stays that way: Intensive apprenticeship<br />
training, continuing development in all areas of the Group, high standards of health and safety, targeted<br />
support for young managers, greater diversity and internationality – including at management level.<br />
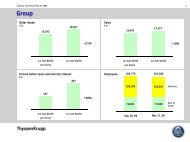
Our workforce grew in the reporting year. On September 30, 2011 ThyssenKrupp employed 180,050 people<br />
worldwide, a year-on-year increase of 2,704 or 1.5%. All the growth took place outside Germany, where the<br />
headcount rose by 4.4% to 110,928. By contrast, employee numbers in Germany fell by 2.7% to 69,122.<br />
The expansion of the new steel making and processing mills in Brazil and the USA in particular created a<br />
large number of new jobs.<br />
Employees by business area (Sept. 30)<br />
2007 2008 2009 2010 2011<br />
Change<br />
in %<br />
Steel Europe 37,749 38,692 36,416 34,711 28,843 (16.9)<br />
Steel Americas 397 1,158 1,659 3,319 4,060 22.3<br />
Materials Services 44,251 47,703 44,316 33,856 36,568 8.0<br />
Elevator Technology 39,501 42,992 42,698 44,024 46,243 5.0<br />
Plant Technology 13,102 13,433 13,043 12,972 13,478 3.9<br />
Components Technology 32,805 32,312 27,973 29,144 31,270 7.3<br />
Marine Systems 8,778 8,288 7,770 5,488 5,295 (3.5)<br />
Corporate 2,585 2,584 1,865 2,597 2,803 7.9<br />
Employees of continuing operations 179,168 187,162 175,740 166,111 168,560 1.5<br />
Stainless Global 12,182 12,212 11,755 11,235 11,490 2.3<br />
Group employees 191,350 199,374 187,495 177,346 180,050 1.5