Engineering
Engineering
Engineering

You also want an ePaper? Increase the reach of your titles
YUMPU automatically turns print PDFs into web optimized ePapers that Google loves.
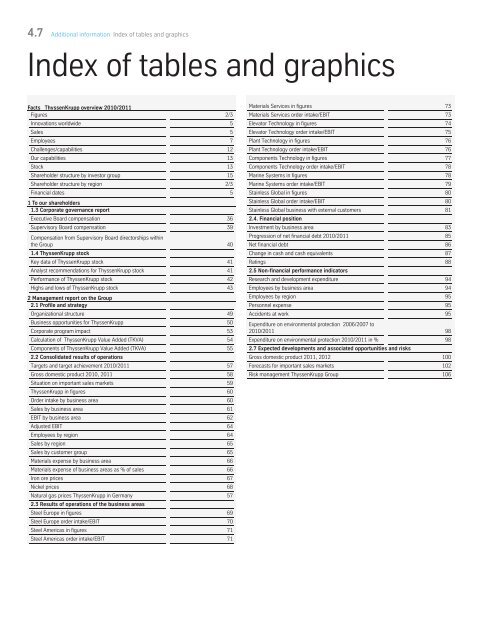
4.7 Additional information Index Index of of tables tables and and graphics<br />
Index of tables and graphics<br />
Facts ThyssenKrupp overview 2010/2011<br />
Figures 2/3<br />
Innovations worldwide 5<br />
Sales 5<br />
Employees 7<br />
Challenges/capabilities 12<br />
Our capabilities 13<br />
Stock 13<br />
Shareholder structure by investor group 15<br />
Shareholder structure by region 2/3<br />
Financial dates 5<br />
1 To our shareholders<br />
1.3 Corporate governance report<br />
Executive Board compensation 36<br />
Supervisory Board compensation 39<br />
Compensation from Supervisory Board directorships within<br />
the Group<br />
1.4 ThyssenKrupp stock<br />
40<br />
Key data of ThyssenKrupp stock 41<br />
Analyst recommendations for ThyssenKrupp stock 41<br />
Performance of ThyssenKrupp stock 42<br />
Highs and lows of ThyssenKrupp stock 43<br />
2 Management report on the Group<br />
2.1 Profile and strategy<br />
Organizational structure 49<br />
Business opportunities for ThyssenKrupp 50<br />
Corporate program impact 53<br />
Calculation of ThyssenKrupp Value Added (TKVA) 54<br />
Components of ThyssenKrupp Value Added (TKVA)<br />
2.2 Consolidated results of operations<br />
55<br />
Targets and target achievement 2010/2011 57<br />
Gross domestic product 2010, 2011 58<br />
Situation on important sales markets 59<br />
ThyssenKrupp in figures 60<br />
Order intake by business area 60<br />
Sales by business area 61<br />
EBIT by business area 62<br />
Adjusted EBIT 64<br />
Employees by region 64<br />
Sales by region 65<br />
Sales by customer group 65<br />
Materials expense by business area 66<br />
Materials expense of business areas as % of sales 66<br />
Iron ore prices 67<br />
Nickel prices 68<br />
Natural gas prices ThyssenKrupp in Germany<br />
2.3 Results of operations of the business areas<br />
57<br />
Steel Europe in figures 69<br />
Steel Europe order intake/EBIT 70<br />
Steel Americas in figures 71<br />
Steel Americas order intake/EBIT 71<br />
Materials Services in figures 73<br />
Materials Services order intake/EBIT 73<br />
Elevator Technology in figures 74<br />
Elevator Technology order intake/EBIT 75<br />
Plant Technology in figures 76<br />
Plant Technology order intake/EBIT 76<br />
Components Technology in figures 77<br />
Components Technology order intake/EBIT 78<br />
Marine Systems in figures 78<br />
Marine Systems order intake/EBIT 79<br />
Stainless Global in figures 80<br />
Stainless Global order intake/EBIT 80<br />
Stainless Global business with external customers<br />
2.4. Financial position<br />
81<br />
Investment by business area 83<br />
Progression of net financial debt 2010/2011 85<br />
Net financial debt 86<br />
Change in cash and cash equivalents 87<br />
Ratings<br />
2.5 Non-financial performance indicators<br />
88<br />
Research and development expenditure 94<br />
Employees by business area 94<br />
Employees by region 95<br />
Personnel expense 95<br />
Accidents at work<br />
Expenditure on environmental protection 2006/2007 to<br />
95<br />
2010/2011 98<br />
Expenditure on environmental protection 2010/2011 in %<br />
2.7 Expected developments and associated opportunities and risks<br />
98<br />
Gross domestic product 2011, 2012 100<br />
Forecasts for important sales markets 102<br />
Risk management ThyssenKrupp Group 106<br />
238