Engineering
Engineering
Engineering

Create successful ePaper yourself
Turn your PDF publications into a flip-book with our unique Google optimized e-Paper software.
3.6 Consolidated financial statements Notes to the consolidated financial statements<br />
3.6 Consolidated financial statements Notes to the consolidated financial statements<br />
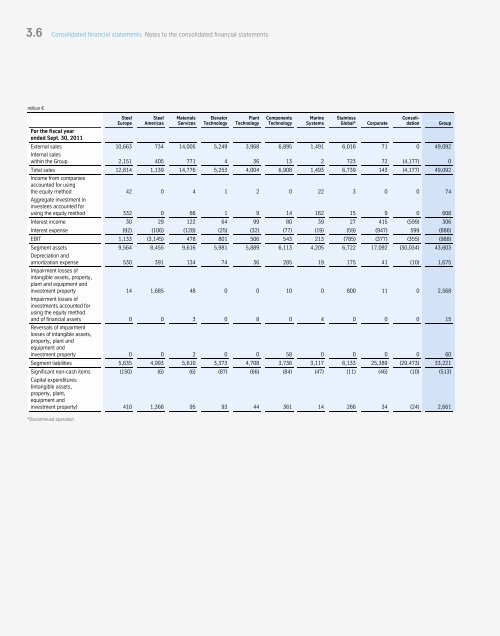
million €<br />
For the fiscal year<br />
ended Sept. 30, 2011<br />
Steel<br />
Europe<br />
Steel<br />
Americas<br />
Materials<br />
Services<br />
Elevator<br />
Technology<br />
Plant<br />
Technology<br />
Components<br />
Technology<br />
Marine<br />
Systems<br />
Stainless<br />
Global* Corporate<br />
190<br />
Consolidation<br />
Group<br />
External sales 10,663 734 14,005 5,249 3,968 6,895 1,491 6,016 71 0 49,092<br />
Internal sales<br />
within the Group 2,151 405 771 4 36 13 2 723 72 (4,177) 0<br />
Total sales 12,814 1,139 14,776 5,253 4,004 6,908 1,493 6,739 143 (4,177) 49,092<br />
Income from companies<br />
accounted for using<br />
the equity method 42 0 4 1 2 0 22 3 0 0 74<br />
Aggregate investment in<br />
investees accounted for<br />
using the equity method 332 0 66 1 9 14 162 15 9 0 608<br />
Interest income 30 29 122 64 99 80 39 27 415 (599) 306<br />
Interest expense (92) (106) (128) (25) (32) (77) (19) (59) (947) 599 (886)<br />
EBIT 1,133 (3,145) 478 801 506 543 213 (785) (377) (355) (988)<br />
Segment assets 9,564 8,455 9,616 5,981 5,889 6,113 4,205 6,722 17,092 (30,034) 43,603<br />
Depreciation and<br />
amortization expense 530 391 134 74 36 285 19 175 41 (10) 1,675<br />
Impairment losses of<br />
intangible assets, property,<br />
plant and equipment and<br />
investment property 14 1,685 48 0 0 10 0 800 11 0 2,568<br />
Impairment losses of<br />
investments accounted for<br />
using the equity method<br />
and of financial assets 0 0 3 0 8 0 4 0 0 0 15<br />
Reversals of impairment<br />
losses of intangible assets,<br />
property, plant and<br />
equipment and<br />
investment property 0 0 2 0 0 58 0 0 0 0 60<br />
Segment liabilities 5,635 4,993 5,610 3,373 4,708 3,736 3,117 6,133 25,389 (29,473) 33,221<br />
Significant non-cash items (150) (6) (6) (87) (66) (84) (47) (11) (46) (10) (513)<br />
Capital expenditures<br />
(intangible assets,<br />
property, plant,<br />
equipment and<br />
investment property) 410 1,368 95 93 44 361 14 266 34 (24) 2,661<br />
*Discontinued operation