Engineering
Engineering
Engineering

Create successful ePaper yourself
Turn your PDF publications into a flip-book with our unique Google optimized e-Paper software.
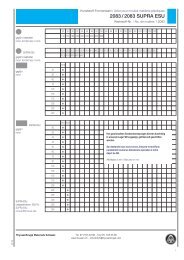
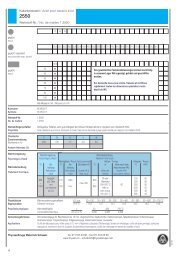
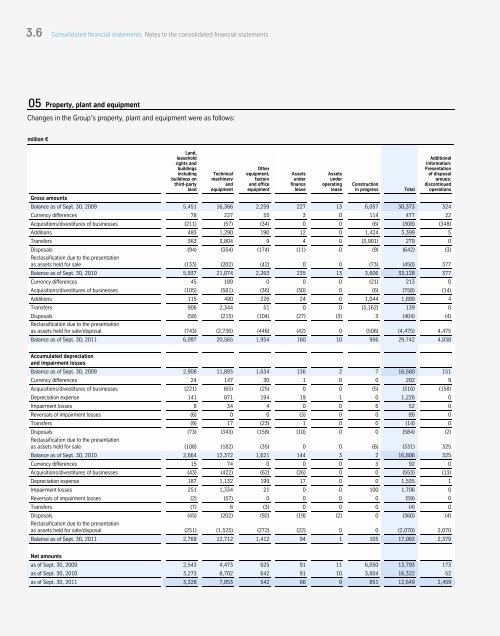
3.6 Consolidated financial statements Notes Notes to to the the consolidated financial financial statements<br />
05 Property, plant and equipment<br />
Changes in the Group’s property, plant and equipment were as follows:<br />
million €<br />
Land,<br />
leasehold<br />
rights and<br />
buildings<br />
including<br />
buildings on<br />
third-party<br />
land<br />
Technical<br />
machinery<br />
and<br />
equipment<br />
Other<br />
equipment,<br />
factory<br />
and office<br />
equipment<br />
Assets<br />
under<br />
finance<br />
lease<br />
Assets<br />
under<br />
operating<br />
lease<br />
Construction<br />
in progress Total<br />
156<br />
Additional<br />
information:<br />
Presentation<br />
of disposal<br />
groups,<br />
discontinued<br />
operations<br />
Gross amounts<br />
Balance as of Sept. 30, 2009 5,451 16,366 2,259 227 13 6,057 30,373 324<br />
Currency differences 78 227 55 3 0 114 477 22<br />
Acquisitions/divestitures of businesses (211) (57) (34) 0 0 (6) (308) (348)<br />
Additions 483 1,290 190 12 0 1,424 3,399 5<br />
Transfers 363 3,804 9 4 0 (3,901) 279 0<br />
Disposals<br />
Reclassification due to the presentation<br />
(94) (354) (174) (11) 0 (9) (642) (3)<br />
as assets held for sale (133) (202) (42) 0 0 (73) (450) 377<br />
Balance as of Sept. 30, 2010 5,937 21,074 2,263 235 13 3,606 33,128 377<br />
Currency differences 45 189 0 0 0 (21) 213 0<br />
Acquisitions/divestitures of businesses (105) (581) (36) (30) 0 (6) (758) (14)<br />
Additions 115 490 226 24 0 1,044 1,899 4<br />
Transfers 906 2,344 51 0 0 (3,162) 139 0<br />
Disposals<br />
Reclassification due to the presentation<br />
(58) (215) (104) (27) (3) 3 (404) (4)<br />
as assets held for sale/disposal (743) (2,736) (446) (42) 0 (508) (4,475) 4,475<br />
Balance as of Sept. 30, 2011 6,097 20,565 1,954 160 10 956 29,742 4,838<br />
Accumulated depreciation<br />
and impairment losses<br />
Balance as of Sept. 30, 2009 2,908 11,893 1,634 136 2 7 16,580 151<br />
Currency differences 24 147 30 1 0 0 202 9<br />
Acquisitions/divestitures of businesses (221) (65) (25) 0 0 (5) (316) (158)<br />
Depreciation expense 141 871 194 19 1 0 1,226 0<br />
Impairment losses 8 34 4 0 0 6 52 0<br />
Reversals of impairment losses (6) 0 0 (3) 0 0 (9) 0<br />
Transfers (9) 17 (23) 1 0 0 (14) 0<br />
Disposals<br />
Reclassification due to the presentation<br />
(73) (343) (158) (10) 0 0 (584) (2)<br />
as assets held for sale (108) (182) (35) 0 0 (6) (331) 325<br />
Balance as of Sept. 30, 2010 2,664 12,372 1,621 144 3 2 16,806 325<br />
Currency differences 15 74 0 0 0 3 92 0<br />
Acquisitions/divestitures of businesses (43) (422) (62) (26) 0 0 (553) (13)<br />
Depreciation expense 187 1,132 199 17 0 0 1,535 1<br />
Impairment losses 251 1,334 21 0 0 100 1,706 0<br />
Reversals of impairment losses (2) (57) 0 0 0 0 (59) 0<br />
Transfers (7) 6 (3) 0 0 0 (4) 0<br />
Disposals<br />
Reclassification due to the presentation<br />
(45) (202) (92) (19) (2) 0 (360) (4)<br />
as assets held for sale/disposal (251) (1,525) (272) (22) 0 0 (2,070) 2,070<br />
Balance as of Sept. 30, 2011 2,769 12,712 1,412 94 1 105 17,093 2,379<br />
Net amounts<br />
as of Sept. 30, 2009 2,543 4,473 625 91 11 6,050 13,793 173<br />
as of Sept. 30, 2010 3,273 8,702 642 91 10 3,604 16,322 52<br />
as of Sept. 30, 2011 3,328 7,853 542 66 9 851 12,649 2,459