Engineering
Engineering
Engineering

You also want an ePaper? Increase the reach of your titles
YUMPU automatically turns print PDFs into web optimized ePapers that Google loves.
2.3 Management report on on the Group Results of of operations of of the the business areas areas<br />
Stainless Global achieved two-digit- two-digitgrowth<br />
in order intake and sales.<br />
Stainless Global (discontinued operation)<br />
Stainless Global in figures<br />
2009/2010 2010/2011 Change in %<br />
Order intake million € 5,121 6,045 18<br />
Sales million € 5,901 6,739 14<br />
EBIT million € (57) (785) – –<br />
EBIT margin % (1.0) (11.6) —<br />
Adjusted EBIT million € (57) 15 126<br />
Adjusted EBIT margin % (1.0) 0.2 —<br />
Employees (Sept. 30) 11,235 11,490 2<br />
The Stainless Global business area supplies premium-quality stainless steel flat products and highperformance<br />
materials such as nickel alloys and titanium.<br />
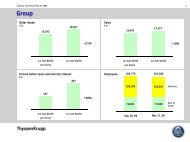
Orders and sales higher<br />
At Stainless Global, business was up from the prior year in the first months of 2010/2011. The value of new<br />
orders increased by 18% to €6.0 billion due to alloy prices; order volumes were 3% down from the prior year<br />
at 2.0 million tons. Whereas volumes decreased slightly in the stainless flat products business, demand for<br />
nickel alloys and titanium increased, which also noticeably increased their selling prices. 2.3 million tons of<br />
stainless flat products and 37,500 tons of high-performance materials were produced. It should be noted<br />
that the prices of high-performance materials are many times higher than those of stainless products.<br />
Overall shipments were 6% down from the prior year at 2.0 million tons. Market demand was noticeably<br />
weaker in the 2nd half of the year. Despite this, sales increased by 14% to around €6.7 billion due to higher<br />
alloy surcharges. Base prices were lower than a year earlier.<br />
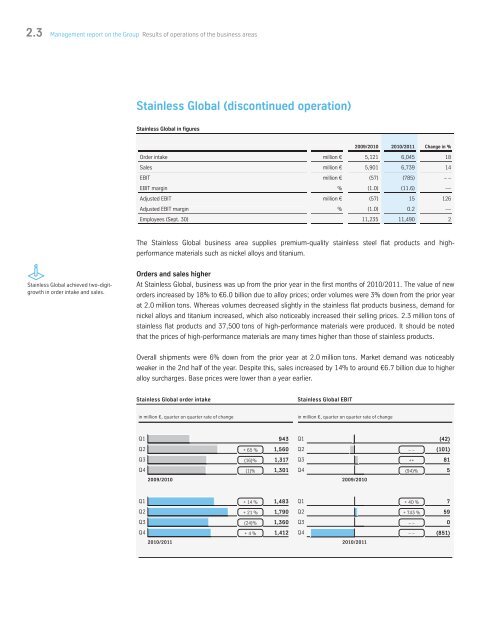
Stainless Global order intake Stainless Global EBIT<br />
in million €, quarter on quarter rate of change in million €, quarter on quarter rate of change<br />
Q1 943 Q1<br />
Q2 + 65 % 1,560 Q2<br />
Q3 (16)% 1,317 Q3<br />
Q4 (1)% 1,301 Q4<br />
2009/2010<br />
Q1 + 14 % 1,483 Q1<br />
Q2 + 21 % 1,790 Q2<br />
Q3 (24)% 1,360 Q3<br />
Q4 + 4 % 1,412 Q4<br />
2010/2011<br />
2009/2010<br />
2010/2011<br />
– –<br />
++<br />
(94)%<br />
+ 40 %<br />
+ 743 %<br />
– –<br />
– –<br />
82<br />
(42)<br />
(101)<br />
81<br />
5<br />
7<br />
59<br />
0<br />
(851)