Engineering
Engineering
Engineering

You also want an ePaper? Increase the reach of your titles
YUMPU automatically turns print PDFs into web optimized ePapers that Google loves.
Management report on the Group<br />
2.1 Management report on the Group Profile and strategy<br />
Page 56<br />
54 | 55<br />
Increasing value through growth, efficiency, capital employed<br />
TKVA can be increased using three levers: profitable growth, higher operating efficiency, and optimized<br />
capital employed. A major contribution to profitable growth and thus to the value of the company is made by<br />
investment projects that generate returns higher than their cost of capital. Higher operating efficiency and<br />
optimum capital employed are also aims of the new impact program. With it we will increase EBIT, reduce<br />
net working capital and so sustainably improve TKVA.<br />
The results of the analysis of the performance indicators feed directly into portfolio management. Group<br />
management decides which businesses are to be expanded to realize set TKVA targets, and which activities<br />
we should withdraw from in a timely way to protect value.<br />
Value-added impacted by impairment charges<br />
In calculating TKVA we applied the new definitions of EBIT and capital employed for the first time from<br />
2010/2011 and adjusted the prior-year figures.<br />
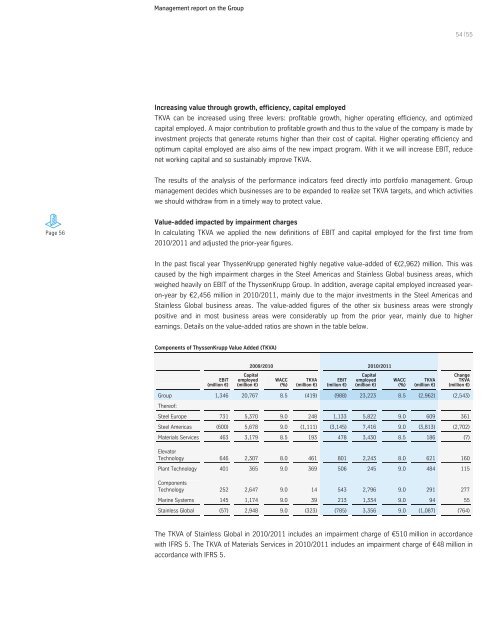
In the past fiscal year ThyssenKrupp generated highly negative value-added of €(2,962) million. This was<br />
caused by the high impairment charges in the Steel Americas and Stainless Global business areas, which<br />
weighed heavily on EBIT of the ThyssenKrupp Group. In addition, average capital employed increased yearon-year<br />
by €2,456 million in 2010/2011, mainly due to the major investments in the Steel Americas and<br />
Stainless Global business areas. The value-added figures of the other six business areas were strongly<br />
positive and in most business areas were considerably up from the prior year, mainly due to higher<br />
earnings. Details on the value-added ratios are shown in the table below.<br />
Components of ThyssenKrupp Value Added (TKVA)<br />
EBIT<br />
(million €)<br />
Capital<br />
employed<br />
(million €)<br />
2009/2010 2010/2011<br />
WACC<br />
(%)<br />
TKVA<br />
(million €)<br />
EBIT<br />
(milion €)<br />
Capital<br />
employed<br />
(million €)<br />
WACC<br />
(%)<br />
TKVA<br />
(million €)<br />
Change<br />
TKVA<br />
(million €)<br />
Group<br />
Thereof:<br />
1,346 20,767 8.5 (419) (988) 23,223 8.5 (2,962) (2,543)<br />
Steel Europe 731 5,370 9.0 248 1,133 5,822 9.0 609 361<br />
Steel Americas (600) 5,678 9.0 (1,111) (3,145) 7,416 9.0 (3,813) (2,702)<br />
Materials Services 463 3,179 8.5 193 478 3,430 8.5 186 (7)<br />
Elevator<br />
Technology 646 2,307 8.0 461 801 2,243 8.0 621 160<br />
Plant Technology 401 365 9.0 369 506 245 9.0 484 115<br />
Components<br />
Technology 252 2,647 9.0 14 543 2,796 9.0 291 277<br />
Marine Systems 145 1,174 9.0 39 213 1,334 9.0 94 55<br />
Stainless Global (57) 2,948 9.0 (323) (785) 3,356 9.0 (1,087) (764)<br />
The TKVA of Stainless Global in 2010/2011 includes an impairment charge of €510 million in accordance<br />
with IFRS 5. The TKVA of Materials Services in 2010/2011 includes an impairment charge of €48 million in<br />
accordance with IFRS 5.