

Yoshida - 1981 - Fundamentals of Rice Crop Science
Yoshida - 1981 - Fundamentals of Rice Crop Science
Yoshida - 1981 - Fundamentals of Rice Crop Science

Create successful ePaper yourself
Turn your PDF publications into a flip-book with our unique Google optimized e-Paper software.
NUTRITIONAL DISORDERS 183<br />
the leaf sheath than in the leaf blade (Table 4.2). Therefore, it would be better to<br />
select the leaf sheath for diagnosis.<br />
The most important point in selecting which plant part to sample is knowing the<br />
relationship <strong>of</strong> a nutrient in the selected plant tissue to plant performance such as<br />
dry weight or tillering. The sample should be collected when the plants are<br />
showing symptoms <strong>of</strong> a disorder. For example, symptoms <strong>of</strong> iron toxicity and zinc<br />
and phosphorus deficiencies are usually seen 2–4 weeks after transplanting.<br />
In plant tissue analysis, analytical errors are much smaller than sampling errors.<br />
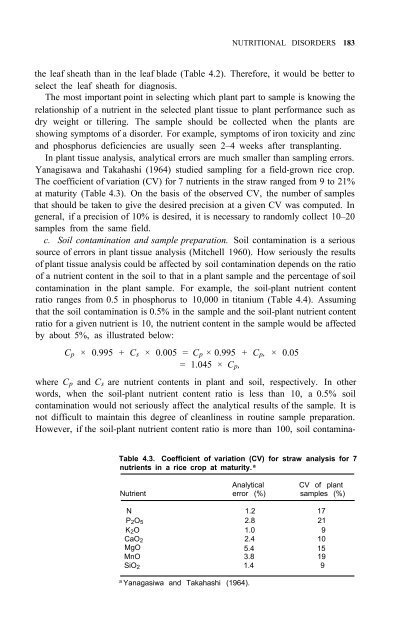
Yanagisawa and Takahashi (1964) studied sampling for a field-grown rice crop.<br />
The coefficient <strong>of</strong> variation (CV) for 7 nutrients in the straw ranged from 9 to 21%<br />
at maturity (Table 4.3). On the basis <strong>of</strong> the observed CV, the number <strong>of</strong> samples<br />
that should be taken to give the desired precision at a given CV was computed. In<br />
general, if a precision <strong>of</strong> 10% is desired, it is necessary to randomly collect 10–20<br />
samples from the same field.<br />
c. Soil contamination and sample preparation. Soil contamination is a serious<br />
source <strong>of</strong> errors in plant tissue analysis (Mitchell 1960). How seriously the results<br />
<strong>of</strong> plant tissue analysis could be affected by soil contamination depends on the ratio<br />
<strong>of</strong> a nutrient content in the soil to that in a plant sample and the percentage <strong>of</strong> soil<br />
contamination in the plant sample. For example, the soil-plant nutrient content<br />
ratio ranges from 0.5 in phosphorus to 10,000 in titanium (Table 4.4). Assuming<br />
that the soil contamination is 0.5% in the sample and the soil-plant nutrient content<br />
ratio for a given nutrient is 10, the nutrient content in the sample would be affected<br />
by about 5%, as illustrated below:<br />
C p × 0.995 + C s × 0.005 = C p × 0.995 + C p , × 0.05<br />
= 1.045 × C p ,<br />
where C p and C s are nutrient contents in plant and soil, respectively. In other<br />
words, when the soil-plant nutrient content ratio is less than 10, a 0.5% soil<br />
contamination would not seriously affect the analytical results <strong>of</strong> the sample. It is<br />
not difficult to maintain this degree <strong>of</strong> cleanliness in routine sample preparation.<br />
However, if the soil-plant nutrient content ratio is more than 100, soil contamina-<br />
Table 4.3. Coefficient <strong>of</strong> variation (CV) for straw analysis for 7<br />
nutrients in a rice crop at maturity. a<br />
Analytical CV <strong>of</strong> plant<br />
Nutrient error (%) samples (%)<br />
N 1.2 17<br />
P 2 O 5 2.8 21<br />
K 2 O 1.0 9<br />
CaO 2 2.4 10<br />
MgO 5.4 15<br />
MnO 3.8 19<br />
SiO 2<br />
1.4 9<br />
a<br />
Yanagasiwa and Takahashi (1964).


