

Yoshida - 1981 - Fundamentals of Rice Crop Science
Yoshida - 1981 - Fundamentals of Rice Crop Science
Yoshida - 1981 - Fundamentals of Rice Crop Science

Create successful ePaper yourself
Turn your PDF publications into a flip-book with our unique Google optimized e-Paper software.
PHOTOSYNTHESIS AND RESPIRATION 211<br />
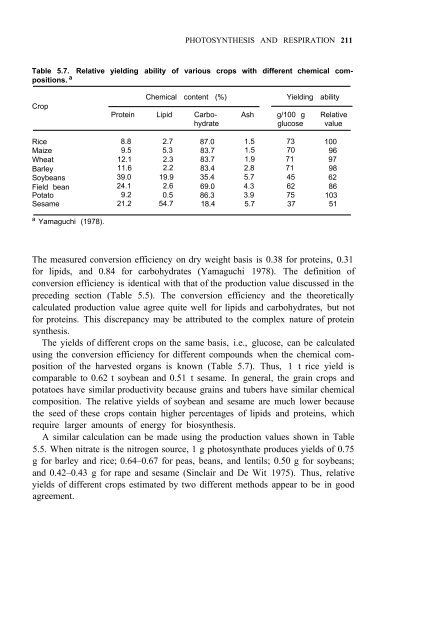
Table 5.7. Relative yielding ability <strong>of</strong> various crops with different chemical compositions.<br />
a Chemical content (%) Yielding ability<br />
<strong>Crop</strong><br />
Protein Lipid Carbo- Ash g/100 g Relative<br />
hydrate glucose value<br />
<strong>Rice</strong> 8.8 2.7 87.0 1.5 73 100<br />
Maize 9.5 5.3 83.7 1.5 70 96<br />
Wheat 12.1 2.3 83.7 1.9 71 97<br />
Barley 11.6 2.2 83.4 2.8 71 98<br />
Soybeans 39.0 19.9 35.4 5.7 45 62<br />
Field bean 24.1 2.6 69.0 4.3 62 86<br />
Potato 9.2 0.5 86.3 3.9 75 103<br />
Sesame 21.2 54.7 18.4 5.7 37 51<br />
a Yamaguchi (1978).<br />
The measured conversion efficiency on dry weight basis is 0.38 for proteins, 0.31<br />
for lipids, and 0.84 for carbohydrates (Yamaguchi 1978). The definition <strong>of</strong><br />
conversion efficiency is identical with that <strong>of</strong> the production value discussed in the<br />
preceding section (Table 5.5). The conversion efficiency and the theoretically<br />
calculated production value agree quite well for lipids and carbohydrates, but not<br />
for proteins. This discrepancy may be attributed to the complex nature <strong>of</strong> protein<br />
synthesis.<br />
The yields <strong>of</strong> different crops on the same basis, i.e., glucose, can be calculated<br />
using the conversion efficiency for different compounds when the chemical composition<br />
<strong>of</strong> the harvested organs is known (Table 5.7). Thus, 1 t rice yield is<br />
comparable to 0.62 t soybean and 0.51 t sesame. In general, the grain crops and<br />
potatoes have similar productivity because grains and tubers have similar chemical<br />
composition. The relative yields <strong>of</strong> soybean and sesame are much lower because<br />
the seed <strong>of</strong> these crops contain higher percentages <strong>of</strong> lipids and proteins, which<br />
require larger amounts <strong>of</strong> energy for biosynthesis.<br />
A similar calculation can be made using the production values shown in Table<br />
5.5. When nitrate is the nitrogen source, 1 g photosynthate produces yields <strong>of</strong> 0.75<br />
g for barley and rice; 0.64–0.67 for peas, beans, and lentils; 0.50 g for soybeans;<br />
and 0.42–0.43 g for rape and sesame (Sinclair and De Wit 1975). Thus, relative<br />
yields <strong>of</strong> different crops estimated by two different methods appear to be in good<br />
agreement.


