

Yoshida - 1981 - Fundamentals of Rice Crop Science
Yoshida - 1981 - Fundamentals of Rice Crop Science
Yoshida - 1981 - Fundamentals of Rice Crop Science

Create successful ePaper yourself
Turn your PDF publications into a flip-book with our unique Google optimized e-Paper software.
PHYSIOLOGICAL ANALYSIS OF RICE YIELD 235<br />
intensity. In a canopy with flat leaves the whole area <strong>of</strong> the top leaf is more exposed<br />
to sunlight than any lower leaf. But in a canopy with very erect leaves, the tips <strong>of</strong><br />
lower leaves may receive more sunlight than the basal part <strong>of</strong> the flag leaf.<br />
7.3. YIELD COMPONENT ANALYSIS<br />
7.3.1. Relative importance <strong>of</strong> yield components<br />
The grain yield can be divided into several components (see Chapter 1). Equation<br />
(1.21) can be rewritten as:<br />
Y= N × W × F × 10 –5 . (7.2)<br />
where Y = grain yield (t/ha),<br />
N = spikelet number/m 2 ,<br />
W = 1,000-grain weight (g), and<br />
F = filled spikelets (%).<br />
Each <strong>of</strong> the yield components differs not only in the time when it is determined but<br />
in its contribution to the grain yield.<br />
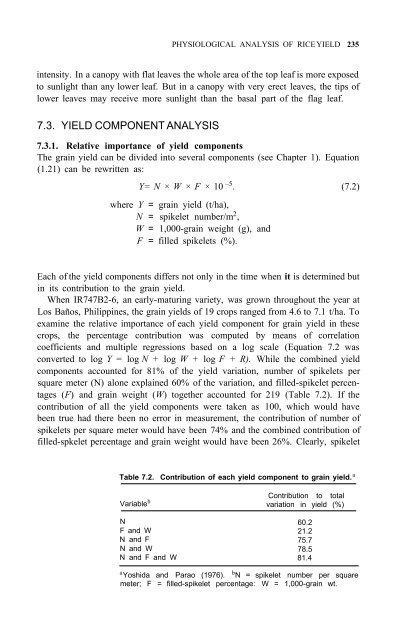
When IR747B2-6, an early-maturing variety, was grown throughout the year at<br />
Los Baños, Philippines, the grain yields <strong>of</strong> 19 crops ranged from 4.6 to 7.1 t/ha. To<br />
examine the relative importance <strong>of</strong> each yield component for grain yield in these<br />
crops, the percentage contribution was computed by means <strong>of</strong> correlation<br />
coefficients and multiple regressions based on a log scale (Equation 7.2 was<br />
converted to log Y = log N + log W + log F + R). While the combined yield<br />
components accounted for 81% <strong>of</strong> the yield variation, number <strong>of</strong> spikelets per<br />
square meter (N) alone explained 60% <strong>of</strong> the variation, and filled-spikelet percentages<br />
( F ) and grain weight ( W ) together accounted for 219 (Table 7.2). If the<br />
contribution <strong>of</strong> all the yield components were taken as 100, which would have<br />
been true had there been no error in measurement, the contribution <strong>of</strong> number <strong>of</strong><br />
spikelets per square meter would have been 74% and the combined contribution <strong>of</strong><br />
filled-spkelet percentage and grain weight would have been 26%. Clearly, spikelet<br />
Table 7.2. Contribution <strong>of</strong> each yield component to grain yield. a<br />
Variable b Contribution to total<br />
variation in yield (%)<br />
N<br />
F and W<br />
N and F<br />
N and W<br />
N and F and W<br />
60.2<br />
21.2<br />
75.7<br />
78.5<br />
81.4<br />
a <strong>Yoshida</strong> and Parao (1976). b<br />
N = spikelet number per square<br />
meter; F = filled-spikelet percentage: W = 1,000-grain wt.


