Yoshida - 1981 - Fundamentals of Rice Crop Science
Yoshida - 1981 - Fundamentals of Rice Crop Science
Yoshida - 1981 - Fundamentals of Rice Crop Science
You also want an ePaper? Increase the reach of your titles
YUMPU automatically turns print PDFs into web optimized ePapers that Google loves.
CLIMATIC ENVIRONMENT AND ITS INFLUENCE 89<br />
are to be achieved. It is, however, inadequate if we refer to the current yield levels<br />
when the national average yield is still about 2 t/ha in most Southeast Asian<br />
countries.<br />
2.4.3. Solar energy use<br />
When solar radiation is incident on a well-developed rice crop, about 20% <strong>of</strong> the<br />
total radiation is reflected into the sky (Murata et al 1968, Kishida 1973). Of the<br />
reflected radiation, only about 10% is photosynthetically active radiation (PAR);<br />
the rest is in the near far red region. In other words, about 3–5% <strong>of</strong> PAR is lost by<br />
reflection at the canopy surface (Fig. 2.16) (Kanda 1975). Taking 5% for the loss<br />
attributed to reflection, about 90% <strong>of</strong> PAR will be absorbed by the leaves and about<br />
5% will be transmitted to the ground.<br />
Photosynthetic efficiency <strong>of</strong> a rice crop can be estimated by:<br />
Photosynthetic<br />
=<br />
efficiency<br />
chemical energy captured by a crop<br />
solar energy received<br />
(2.7)<br />
In practice, however, there are several ways <strong>of</strong> computing the photosynthetic<br />
efficiency. First, chemical energy can be estimated in terms <strong>of</strong> net gains or gross.<br />
Second, solar radiation may be expressed in terms <strong>of</strong> total incident radiation, PAR,<br />
or absorbed PAR. The simplest and most widely used measurement uses net gains<br />
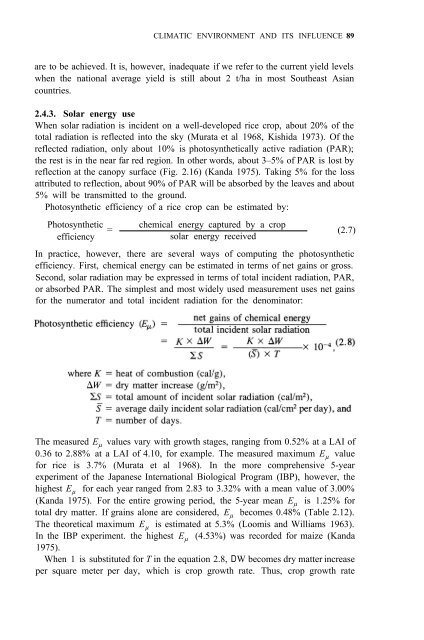
for the numerator and total incident radiation for the denominator:<br />
The measured E µ values vary with growth stages, ranging from 0.52% at a LAI <strong>of</strong><br />
0.36 to 2.88% at a LAI <strong>of</strong> 4.10, for example. The measured maximum E µ value<br />
for rice is 3.7% (Murata et al 1968). In the more comprehensive 5-year<br />
experiment <strong>of</strong> the Japanese International Biological Program (IBP), however, the<br />
highest E µ for each year ranged from 2.83 to 3.32% with a mean value <strong>of</strong> 3.00%<br />
(Kanda 1975). For the entire growing period, the 5-year mean E µ is 1.25% for<br />
total dry matter. If grains alone are considered, E µ becomes 0.48% (Table 2.12).<br />
The theoretical maximum E µ is estimated at 5.3% (Loomis and Williams 1963).<br />
In the IBP experiment. the highest E µ (4.53%) was recorded for maize (Kanda<br />
1975).<br />
When 1 is substituted for T in the equation 2.8, D W becomes dry matter increase<br />
per square meter per day, which is crop growth rate. Thus, crop growth rate


