airport/documents/Mesquite Master Plan Final.pdf - The City of ...
airport/documents/Mesquite Master Plan Final.pdf - The City of ...
airport/documents/Mesquite Master Plan Final.pdf - The City of ...

Create successful ePaper yourself
Turn your PDF publications into a flip-book with our unique Google optimized e-Paper software.
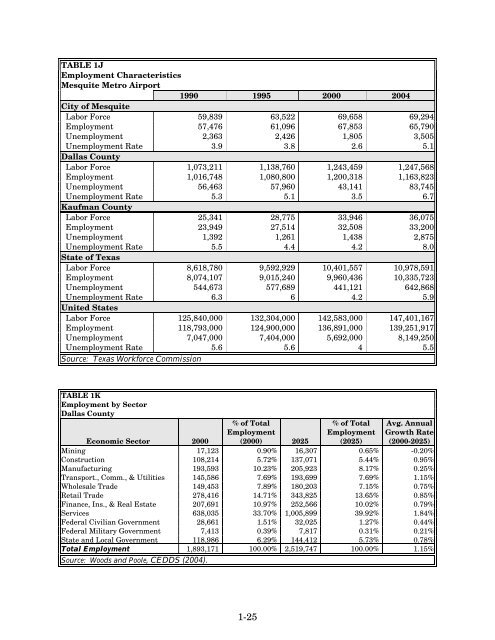
TABLE 1J<br />
Employment Characteristics<br />
<strong>Mesquite</strong> Metro Airport<br />
1990 1995 2000 2004<br />
<strong>City</strong> <strong>of</strong> <strong>Mesquite</strong><br />
Labor Force 59,839 63,522 69,658 69,294<br />
Employment 57,476 61,096 67,853 65,790<br />
Unemployment 2,363 2,426 1,805 3,505<br />
Unemployment Rate 3.9 3.8 2.6 5.1<br />
Dallas County<br />
Labor Force 1,073,211 1,138,760 1,243,459 1,247,568<br />
Employment 1,016,748 1,080,800 1,200,318 1,163,823<br />
Unemployment 56,463 57,960 43,141 83,745<br />
Unemployment Rate 5.3 5.1 3.5 6.7<br />
Kaufman County<br />
Labor Force 25,341 28,775 33,946 36,075<br />
Employment 23,949 27,514 32,508 33,200<br />
Unemployment 1,392 1,261 1,438 2,875<br />
Unemployment Rate 5.5 4.4 4.2 8.0<br />
State <strong>of</strong> Texas<br />
Labor Force 8,618,780 9,592,929 10,401,557 10,978,591<br />
Employment 8,074,107 9,015,240 9,960,436 10,335,723<br />
Unemployment 544,673 577,689 441,121 642,868<br />
Unemployment Rate 6.3 6 4.2 5.9<br />
United States<br />
Labor Force 125,840,000 132,304,000 142,583,000 147,401,167<br />
Employment 118,793,000 124,900,000 136,891,000 139,251,917<br />
Unemployment 7,047,000 7,404,000 5,692,000 8,149,250<br />
Unemployment Rate 5.6 5.6 4 5.5<br />
Source: Texas Workforce Commission<br />
TABLE 1K<br />
Employment by Sector<br />
Dallas County<br />
Economic Sector 2000<br />
% <strong>of</strong> Total<br />
Employment<br />
(2000) 2025<br />
1-25<br />
% <strong>of</strong> Total<br />
Employment<br />
(2025)<br />
Avg. Annual<br />
Growth Rate<br />
(2000-2025)<br />
Mining 17,123 0.90% 16,307 0.65% -0.20%<br />
Construction 108,214 5.72% 137,071 5.44% 0.95%<br />
Manufacturing 193,593 10.23% 205,923 8.17% 0.25%<br />
Transport., Comm., & Utilities 145,586 7.69% 193,699 7.69% 1.15%<br />
Wholesale Trade 149,453 7.89% 180,203 7.15% 0.75%<br />
Retail Trade 278,416 14.71% 343,825 13.65% 0.85%<br />
Finance, Ins., & Real Estate 207,691 10.97% 252,566 10.02% 0.79%<br />
Services 638,035 33.70% 1,005,899 39.92% 1.84%<br />
Federal Civilian Government 28,661 1.51% 32,025 1.27% 0.44%<br />
Federal Military Government 7,413 0.39% 7,817 0.31% 0.21%<br />
State and Local Government 118,986 6.29% 144,412 5.73% 0.78%<br />
Total Employment 1,893,171 100.00% 2,519,747 100.00% 1.15%<br />
Source: Woods and Poole, CEDDS (2004).