Redaction_ apres_COREAMR - DRIAAF Ile-de-France - Ministère ...
Redaction_ apres_COREAMR - DRIAAF Ile-de-France - Ministère ...
Redaction_ apres_COREAMR - DRIAAF Ile-de-France - Ministère ...

Create successful ePaper yourself
Turn your PDF publications into a flip-book with our unique Google optimized e-Paper software.
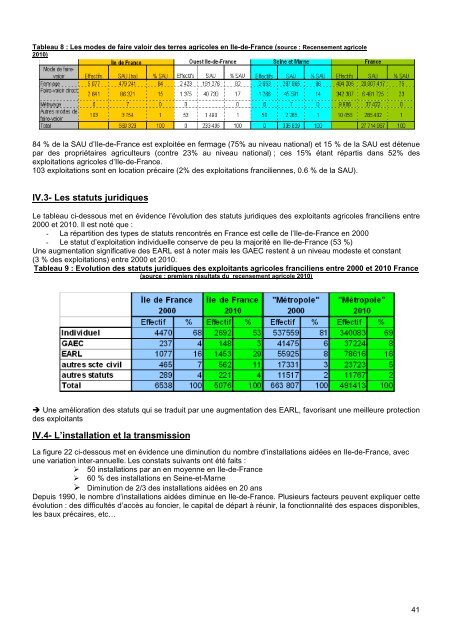
Tableau 8 : Les mo<strong>de</strong>s <strong>de</strong> faire valoir <strong>de</strong>s terres agricoles en <strong>Ile</strong>-<strong>de</strong>-<strong>France</strong> (source : Recensement agricole<br />
2010)<br />
84 % <strong>de</strong> la SAU d’<strong>Ile</strong>-<strong>de</strong>-<strong>France</strong> est exploitée en fermage (75% au niveau national) et 15 % <strong>de</strong> la SAU est détenue<br />
par <strong>de</strong>s propriétaires agriculteurs (contre 23% au niveau national) ; ces 15% étant répartis dans 52% <strong>de</strong>s<br />
exploitations agricoles d’<strong>Ile</strong>-<strong>de</strong>-<strong>France</strong>.<br />
103 exploitations sont en location précaire (2% <strong>de</strong>s exploitations franciliennes, 0.6 % <strong>de</strong> la SAU).<br />
IV.3- Les statuts juridiques<br />
Le tableau ci-<strong>de</strong>ssous met en évi<strong>de</strong>nce l’évolution <strong>de</strong>s statuts juridiques <strong>de</strong>s exploitants agricoles franciliens entre<br />
2000 et 2010. Il est noté que :<br />
- La répartition <strong>de</strong>s types <strong>de</strong> statuts rencontrés en <strong>France</strong> est celle <strong>de</strong> l’<strong>Ile</strong>-<strong>de</strong>-<strong>France</strong> en 2000<br />
- Le statut d’exploitation individuelle conserve <strong>de</strong> peu la majorité en <strong>Ile</strong>-<strong>de</strong>-<strong>France</strong> (53 %)<br />
Une augmentation significative <strong>de</strong>s EARL est à noter mais les GAEC restent à un niveau mo<strong>de</strong>ste et constant<br />
(3 % <strong>de</strong>s exploitations) entre 2000 et 2010.<br />
Tableau 9 : Evolution <strong>de</strong>s statuts juridiques <strong>de</strong>s exploitants agricoles franciliens entre 2000 et 2010 <strong>France</strong><br />
(source : premiers résultats du recensement agricole 2010)<br />
Une amélioration <strong>de</strong>s statuts qui se traduit par une augmentation <strong>de</strong>s EARL, favorisant une meilleure protection<br />
<strong>de</strong>s exploitants<br />
IV.4- L’installation et la transmission<br />
La figure 22 ci-<strong>de</strong>ssous met en évi<strong>de</strong>nce une diminution du nombre d’installations aidées en <strong>Ile</strong>-<strong>de</strong>-<strong>France</strong>, avec<br />
une variation inter-annuelle. Les constats suivants ont été faits :<br />
50 installations par an en moyenne en <strong>Ile</strong>-<strong>de</strong>-<strong>France</strong><br />
60 % <strong>de</strong>s installations en Seine-et-Marne<br />
Diminution <strong>de</strong> 2/3 <strong>de</strong>s installations aidées en 20 ans<br />
Depuis 1990, le nombre d’installations aidées diminue en <strong>Ile</strong>-<strong>de</strong>-<strong>France</strong>. Plusieurs facteurs peuvent expliquer cette<br />
évolution : <strong>de</strong>s difficultés d’accès au foncier, le capital <strong>de</strong> départ à réunir, la fonctionnalité <strong>de</strong>s espaces disponibles,<br />
les baux précaires, etc…<br />
41