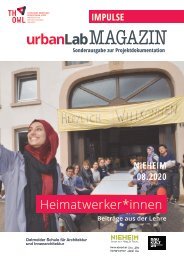
urbanLab Magazin 2021 - Transformation

Erfolgreiche ePaper selbst erstellen
Machen Sie aus Ihren PDF Publikationen ein blätterbares Flipbook mit unserer einzigartigen Google optimierten e-Paper Software.
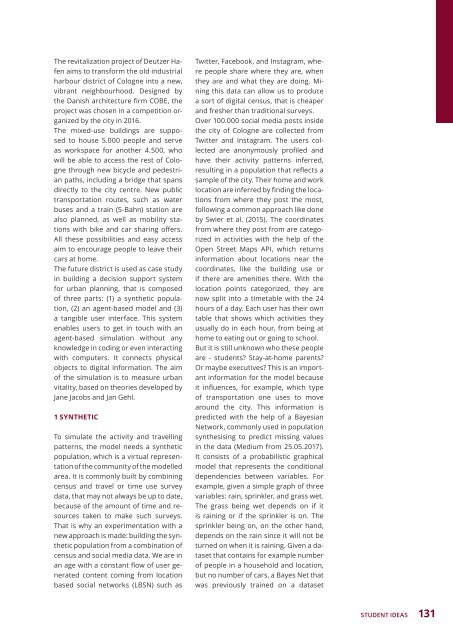
The revitalization project of Deutzer Hafen<br />
aims to transform the old industrial<br />
harbour district of Cologne into a new,<br />
vibrant neighbourhood. Designed by<br />
the Danish architecture firm COBE, the<br />
project was chosen in a competition organized<br />
by the city in 2016.<br />
The mixed-use buildings are supposed<br />
to house 5.000 people and serve<br />
as workspace for another 4.500, who<br />
will be able to access the rest of Cologne<br />
through new bicycle and pedestrian<br />
paths, including a bridge that spans<br />
directly to the city centre. New public<br />
transportation routes, such as water<br />
buses and a train (S-Bahn) station are<br />
also planned, as well as mobility stations<br />
with bike and car sharing offers.<br />
All these possibilities and easy access<br />
aim to encourage people to leave their<br />
cars at home.<br />
The future district is used as case study<br />
in building a decision support system<br />
for urban planning, that is composed<br />
of three parts: (1) a synthetic population,<br />
(2) an agent-based model and (3)<br />
a tangible user interface. This system<br />
enables users to get in touch with an<br />
agent-based simulation without any<br />
knowledge in coding or even interacting<br />
with computers. It connects physical<br />
objects to digital information. The aim<br />
of the simulation is to measure urban<br />
vitality, based on theories developed by<br />
Jane Jacobs and Jan Gehl.<br />
1 SYNTHETIC<br />
To simulate the activity and travelling<br />
patterns, the model needs a synthetic<br />
population, which is a virtual representation<br />
of the community of the modelled<br />
area. It is commonly built by combining<br />
census and travel or time use survey<br />
data, that may not always be up to date,<br />
because of the amount of time and resources<br />
taken to make such surveys.<br />
That is why an experimentation with a<br />
new approach is made: building the synthetic<br />
population from a combination of<br />
census and social media data. We are in<br />
an age with a constant flow of user generated<br />
content coming from location<br />
based social networks (LBSN) such as<br />
Twitter, Facebook, and Instagram, where<br />
people share where they are, when<br />
they are and what they are doing. Mining<br />
this data can allow us to produce<br />
a sort of digital census, that is cheaper<br />
and fresher than traditional surveys.<br />
Over 100.000 social media posts inside<br />
the city of Cologne are collected from<br />
Twitter and Instagram. The users collected<br />
are anonymously profiled and<br />
have their activity patterns inferred,<br />
resulting in a population that reflects a<br />
sample of the city. Their home and work<br />
location are inferred by finding the locations<br />
from where they post the most,<br />
following a common approach like done<br />
by Swier et al. (2015). The coordinates<br />
from where they post from are categorized<br />
in activities with the help of the<br />
Open Street Maps API, which returns<br />
information about locations near the<br />
coordinates, like the building use or<br />
if there are amenities there. With the<br />
location points categorized, they are<br />
now split into a timetable with the 24<br />
hours of a day. Each user has their own<br />
table that shows which activities they<br />
usually do in each hour, from being at<br />
home to eating out or going to school.<br />
But it is still unknown who these people<br />
are - students? Stay-at-home parents?<br />
Or maybe executives? This is an important<br />
information for the model because<br />
it influences, for example, which type<br />
of transportation one uses to move<br />
around the city. This information is<br />
predicted with the help of a Bayesian<br />
Network, commonly used in population<br />
synthesising to predict missing values<br />
in the data (Medium from 25.05.2017).<br />
It consists of a probabilistic graphical<br />
model that represents the conditional<br />
dependencies between variables. For<br />
example, given a simple graph of three<br />
variables: rain, sprinkler, and grass wet.<br />
The grass being wet depends on if it<br />
is raining or if the sprinkler is on. The<br />
sprinkler being on, on the other hand,<br />
depends on the rain since it will not be<br />
turned on when it is raining. Given a dataset<br />
that contains for example number<br />
of people in a household and location,<br />
but no number of cars, a Bayes Net that<br />
was previously trained on a dataset<br />
STUDENT IDEAS<br />
131