

Maritime Trade and Transport - HWWI
Maritime Trade and Transport - HWWI
Maritime Trade and Transport - HWWI

You also want an ePaper? Increase the reach of your titles
YUMPU automatically turns print PDFs into web optimized ePapers that Google loves.
Three-quarters of the vessels in the multi-purpose fleet are used for regional or feeder transport,<br />
half of these vessels in Asia, the rest especially on north-south routes <strong>and</strong> in trade with developing<br />
countries. Since only few such ships have been built or ordered <strong>and</strong> the existing fleet<br />
already has an average age of 16 years, the segment offers promising perspectives. 28<br />
5.2.4 Tanker shipping<br />
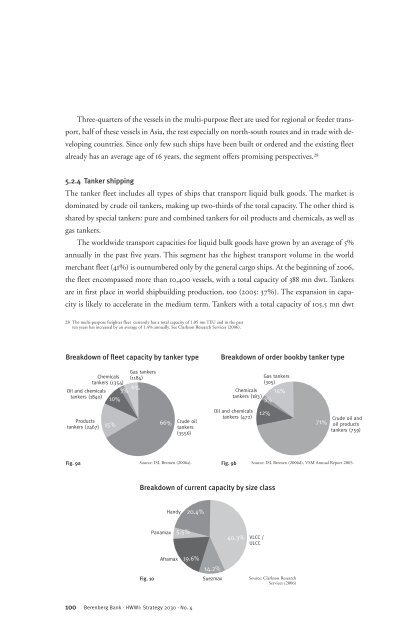
The tanker fleet includes all types of ships that transport liquid bulk goods. The market is<br />
dominated by crude oil tankers, making up two-thirds of the total capacity. The other third is<br />
shared by special tankers: pure <strong>and</strong> combined tankers for oil products <strong>and</strong> chemicals, as well as<br />
gas tankers.<br />
The worldwide transport capacities for liquid bulk goods have grown by an average of 5%<br />
annually in the past five years. This segment has the highest transport volume in the world<br />
merchant fleet (41%) is outnumbered only by the general cargo ships. At the beginning of 2006,<br />
the fleet encompassed more than 10,400 vessels, with a total capacity of 388 mn dwt. Tankers<br />
are in first place in world shipbuilding production, too (2005: 37%). The expansion in capacity<br />
is likely to accelerate in the medium term. Tankers with a total capacity of 105.5 mn dwt<br />
28 The multi-purpose freighter fleet currently has a total capacity of 1.05 mn TEU <strong>and</strong> in the past<br />
ten years has increased by an average of 1.4% annually. See Clarkson Research Services (2006).<br />
Breakdown of fleet capacity by tanker type Breakdown of order bookby tanker type<br />
Gas tankers<br />
Chemicals (1184)<br />
tankers (1354)<br />
6%<br />
Oil <strong>and</strong> chemicals 3%<br />
tankers (1840) 10%<br />
Products<br />
tankers (2467)<br />
15%<br />
66%<br />
Crude oil<br />
tankers<br />
(3556)<br />
100 Berenberg Bank · <strong>HWWI</strong>: Strategy 2030 · No. 4<br />
Gas tankers<br />
(305)<br />
Chemicals 14%<br />
tankers (183)<br />
3%<br />
Oil <strong>and</strong> chemicals<br />
tankers (472)<br />
12%<br />
71%<br />
Crude oil <strong>and</strong><br />
oil products<br />
tankers (759)<br />
Fig. 9a Source: ISL Bremen (2006a).<br />
Fig. 9b Source: ISL Bremen (2006d), VSM Annual Report 2005.<br />
Breakdown of current capacity by size class<br />
Fig. 10<br />
Panamax<br />
H<strong>and</strong>y<br />
Aframax<br />
5.5%<br />
20.4%<br />
19.6%<br />
14.2%<br />
Suezmax<br />
40.3%<br />
VLCC /<br />
ULCC<br />
Source: Clarkson Research<br />
Services (2006)


