

Maritime Trade and Transport - HWWI
Maritime Trade and Transport - HWWI
Maritime Trade and Transport - HWWI

You also want an ePaper? Increase the reach of your titles
YUMPU automatically turns print PDFs into web optimized ePapers that Google loves.
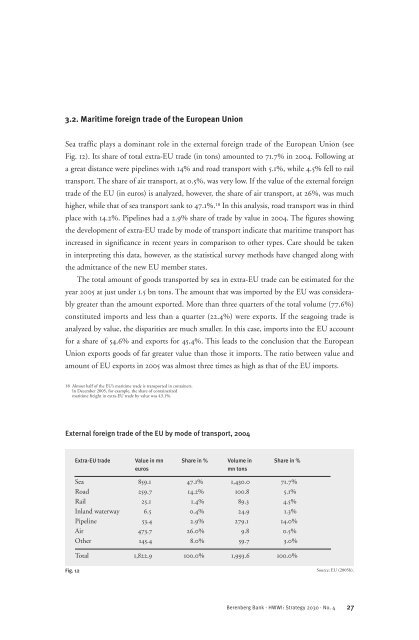
3.2. <strong>Maritime</strong> foreign trade of the European Union<br />
Sea traffic plays a dominant role in the external foreign trade of the European Union (see<br />
Fig. 12). Its share of total extra-EU trade (in tons) amounted to 71.7% in 2004. Following at<br />
a great distance were pipelines with 14% <strong>and</strong> road transport with 5.1%, while 4.5% fell to rail<br />
transport. The share of air transport, at 0.5%, was very low. If the value of the external foreign<br />
trade of the EU (in euros) is analyzed, however, the share of air transport, at 26%, was much<br />
higher, while that of sea transport sank to 47.1%. 18 In this analysis, road transport was in third<br />
place with 14.2%. Pipelines had a 2.9% share of trade by value in 2004. The figures showing<br />
the development of extra-EU trade by mode of transport indicate that maritime transport has<br />
increased in significance in recent years in comparison to other types. Care should be taken<br />
in interpreting this data, however, as the statistical survey methods have changed along with<br />
the admittance of the new EU member states.<br />
The total amount of goods transported by sea in extra-EU trade can be estimated for the<br />
year 2005 at just under 1.5 bn tons. The amount that was imported by the EU was considerably<br />
greater than the amount exported. More than three quarters of the total volume (77.6%)<br />
constituted imports <strong>and</strong> less than a quarter (22.4%) were exports. If the seagoing trade is<br />
analyzed by value, the disparities are much smaller. In this case, imports into the EU account<br />
for a share of 54.6% <strong>and</strong> exports for 45.4%. This leads to the conclusion that the European<br />
Union exports goods of far greater value than those it imports. The ratio between value <strong>and</strong><br />
amount of EU exports in 2005 was almost three times as high as that of the EU imports.<br />
18 Almost half of the EU’s maritime trade is transported in containers.<br />
In December 2005, for example, the share of containerized<br />
maritime freight in extra-EU trade by value was 43.1%.<br />
External foreign trade of the EU by mode of transport, 2004<br />
Fig. 12<br />
Extra-EU trade Value in mn Share in % Volume in Share in %<br />
euros mn tons<br />
Sea 859.1 47.1% 1,430.0 71.7%<br />
Road 259.7 14.2% 100.8 5.1%<br />
Rail 25.1 1.4% 89.3 4.5%<br />
Inl<strong>and</strong> waterway 6.5 0.4% 24.9 1.3%<br />
Pipeline 53.4 2.9% 279.1 14.0%<br />
Air 473.7 26.0% 9.8 0.5%<br />
Other 145.4 8.0% 59.7 3.0%<br />
Total 1,822.9 100.0% 1,993.6 100.0%<br />
Berenberg Bank · <strong>HWWI</strong>: Strategy 2030 · No. 4<br />
Source: EU (2005b).<br />
27


