

Maritime Trade and Transport - HWWI
Maritime Trade and Transport - HWWI
Maritime Trade and Transport - HWWI

You also want an ePaper? Increase the reach of your titles
YUMPU automatically turns print PDFs into web optimized ePapers that Google loves.
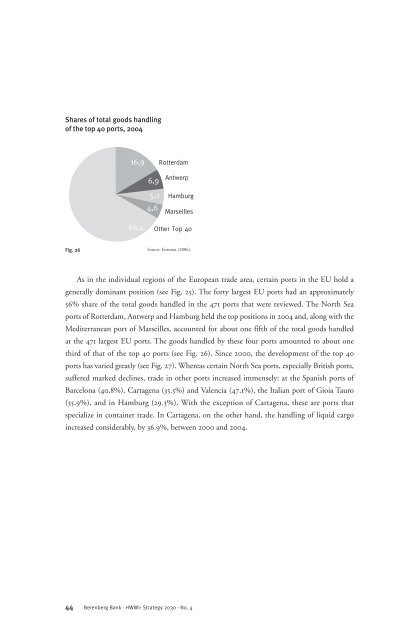
Shares of total goods h<strong>and</strong>ling<br />
of the top 40 ports, 2004<br />
Fig. 26<br />
16,9<br />
66,4<br />
Rotterdam<br />
6,9<br />
Antwerp<br />
5,1 Hamburg<br />
4,6<br />
Marseilles<br />
Other Top 40<br />
Source: Eurostat (2006).<br />
As in the individual regions of the European trade area, certain ports in the EU hold a<br />
generally dominant position (see Fig. 25). The forty largest EU ports had an approximately<br />
56% share of the total goods h<strong>and</strong>led in the 471 ports that were reviewed. The North Sea<br />
ports of Rotterdam, Antwerp <strong>and</strong> Hamburg held the top positions in 2004 <strong>and</strong>, along with the<br />
Mediterranean port of Marseilles, accounted for about one fifth of the total goods h<strong>and</strong>led<br />
at the 471 largest EU ports. The goods h<strong>and</strong>led by these four ports amounted to about one<br />
third of that of the top 40 ports (see Fig. 26). Since 2000, the development of the top 40<br />
ports has varied greatly (see Fig. 27). Whereas certain North Sea ports, especially British ports,<br />
suffered marked declines, trade in other ports increased immensely: at the Spanish ports of<br />
Barcelona (40.8%), Cartagena (35.5%) <strong>and</strong> Valencia (47.1%), the Italian port of Gioia Tauro<br />
(35.9%), <strong>and</strong> in Hamburg (29.3%). With the exception of Cartagena, these are ports that<br />
specialize in container trade. In Cartagena, on the other h<strong>and</strong>, the h<strong>and</strong>ling of liquid cargo<br />
increased considerably, by 36.9%, between 2000 <strong>and</strong> 2004.<br />
44 Berenberg Bank · <strong>HWWI</strong>: Strategy 2030 · No. 4


