

Maritime Trade and Transport - HWWI
Maritime Trade and Transport - HWWI
Maritime Trade and Transport - HWWI

You also want an ePaper? Increase the reach of your titles
YUMPU automatically turns print PDFs into web optimized ePapers that Google loves.
200<br />
160<br />
120<br />
80<br />
40<br />
This may seem like a large amount, considering a capital stock only for roads <strong>and</strong> rails<br />
which was estimated in 2000 at $6,000 bn. However, replacement investments of 2% annually<br />
<strong>and</strong> the states’ longst<strong>and</strong>ing substantial underinvestment in maintenance <strong>and</strong> servicing<br />
should also be kept in mind. According to the OECD, world investments in road <strong>and</strong> rail, currently<br />
amounting to almost 0.5% of world economic output, will decrease continuously over<br />
the entire period to 0.35% (2030). 82<br />
Conclusion: Whether the average expansion in transport infrastructure of almost 1.2%<br />
annually will be sufficient to meet the rapidly surging dem<strong>and</strong> is questionable. With a rapid<br />
globalization pace (until 2015) <strong>and</strong> the perspective of burgeoning private funding of economic<br />
infrastructure, a high investment potential is likely in the medium term.<br />
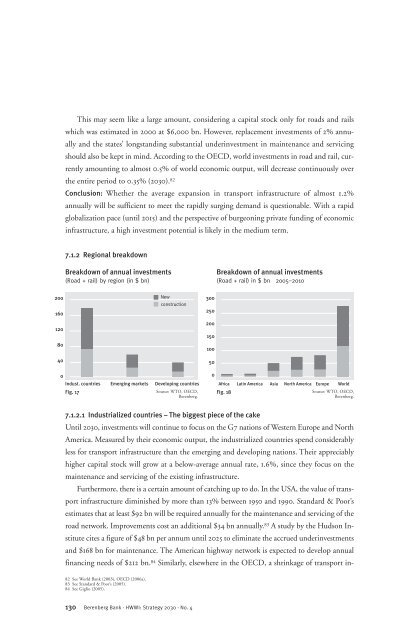
7.1.2 Regional breakdown<br />
Breakdown of annual investments<br />
(Road + rail) by region (in $ bn)<br />
0<br />
Indust. countries Emerging markets Developing countries<br />
Fig. 17<br />
Source: WTO, OECD,<br />
Berenberg.<br />
7.1.2.1 Industrialized countries – The biggest piece of the cake<br />
Until 2030, investments will continue to focus on the G7 nations of Western Europe <strong>and</strong> North<br />
America. Measured by their economic output, the industrialized countries spend considerably<br />
less for transport infrastructure than the emerging <strong>and</strong> developing nations. Their appreciably<br />
higher capital stock will grow at a below-average annual rate, 1.6%, since they focus on the<br />
maintenance <strong>and</strong> servicing of the existing infrastructure.<br />
Furthermore, there is a certain amount of catching up to do. In the USA, the value of transport<br />
infrastructure diminished by more than 13% between 1950 <strong>and</strong> 1990. St<strong>and</strong>ard & Poor’s<br />
estimates that at least $92 bn will be required annually for the maintenance <strong>and</strong> servicing of the<br />
road network. Improvements cost an additional $34 bn annually. 83 A study by the Hudson Institute<br />
cites a figure of $48 bn per annum until 2025 to eliminate the accrued underinvestments<br />
<strong>and</strong> $168 bn for maintenance. The American highway network is expected to develop annual<br />
financing needs of $212 bn. 84 Similarly, elsewhere in the OECD, a shrinkage of transport in-<br />
82 See World Bank (2003), OECD (2006a).<br />
83 See St<strong>and</strong>ard & Poor’s (2005).<br />
84 See Giglio (2005).<br />
New<br />
construction<br />
130 Berenberg Bank · <strong>HWWI</strong>: Strategy 2030 · No. 4<br />
300<br />
250<br />
200<br />
150<br />
100<br />
50<br />
0<br />
Breakdown of annual investments<br />
(Road + rail) in $ bn 2005–2010<br />
Africa Latin America Asia North America Europe World<br />
Fig. 18<br />
Source: WTO, OECD,<br />
Berenberg.


