

Maritime Trade and Transport - HWWI
Maritime Trade and Transport - HWWI
Maritime Trade and Transport - HWWI

You also want an ePaper? Increase the reach of your titles
YUMPU automatically turns print PDFs into web optimized ePapers that Google loves.
8%<br />
6%<br />
4%<br />
2%<br />
0%<br />
of 3.5% for dry bulk goods until 2010, which will level off to 2.1% by 2015. In the more distant<br />
future, the authority anticipates annual growth of only 1.2%. 23 Since the main export countries<br />
for ore <strong>and</strong> coal (Australia, Brazil <strong>and</strong> South Africa) are far away from the consuming countries,<br />
transport by ship is the only option, <strong>and</strong> as the importing countries are successively diversifying<br />
their sources, the transport distance may increase slightly in the future.<br />
With a capacity of 342 mn dwt, the 6,631 bulk freighters accounted for the second<br />
highest share of the world merchant fleet, with a good 36% of the tonnage, at the beginning of<br />
2006. 24 Beginning in 2004, a reaction to the commodities boom was noted in the form of new<br />
ship construction <strong>and</strong> orders for bulk freighters. This was relatively late – but, in the final analysis,<br />
so vigorous that growth in supply was expected to surpass growth in dem<strong>and</strong> in the course<br />
of the year. The market’s sensitivity to sinking trade growth is increasing. Due to the high shipping<br />
rates, however, hardly any bulk freighters have been scrapped recently, so that almost one<br />
in three freighters is overaged. In view of the buoyant dem<strong>and</strong> for replacements <strong>and</strong> the fact that<br />
shipyards are working to capacity, there is little danger of a surplus in the immediate future.<br />
Assuming that an additional 70-90 mn t of coal <strong>and</strong> ore will still have to be transported annually,<br />
the gap between growth in cargo volume <strong>and</strong> tonnage is expected to close more rapidly only<br />
as of 2010. However, the slower globalization tempo we predict for the period beginning in<br />
2015 is likely to affect this sector as well.<br />
There are four size categories in bulk shipping vessels. In regard to operating <strong>and</strong> investment<br />
expenses, larger ships are generally more cost-effective than smaller ones, hence ships are becoming<br />
progressively larger. The delivery of large freighters increased considerably in recent<br />
years, while the number of the smallest bulk carriers fell. The global order book, which at the<br />
beginning of 2006, with tonnage of 68.4 mn dwt, accounted for about 20% of the current fleet<br />
capacity, points to a continuation of this trend. 25 In contrast to container ships, however, there<br />
are no efforts to push up the size limits, set at 365,000 dwt since 1986.<br />
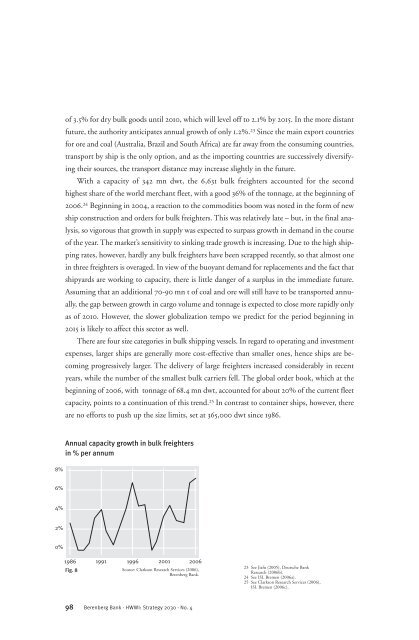
Annual capacity growth in bulk freighters<br />
in % per annum<br />
1986 1991 1996 2001 2006<br />
Fig. 8<br />
Source: Clarkson Research Services (2006),<br />
Berenberg Bank.<br />
98 Berenberg Bank · <strong>HWWI</strong>: Strategy 2030 · No. 4<br />
23 See Jiafu (2005), Deutsche Bank<br />
Research (2006b).<br />
24 See ISL Bremen (2006a).<br />
25 See Clarkson Research Services (2006),<br />
ISL Bremen (2006c).


