

Maritime Trade and Transport - HWWI
Maritime Trade and Transport - HWWI
Maritime Trade and Transport - HWWI

Create successful ePaper yourself
Turn your PDF publications into a flip-book with our unique Google optimized e-Paper software.
15%<br />
10%<br />
5%<br />
0%<br />
20%<br />
15%<br />
10%<br />
5%<br />
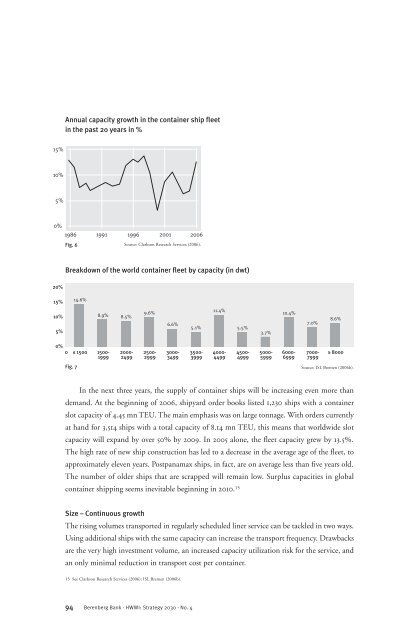
Annual capacity growth in the container ship fleet<br />
in the past 20 years in %<br />
1986 1991 1996 2001 2006<br />
Fig. 6<br />
Source: Clarkson Research Services (2006).<br />
Breakdown of the world container fleet by capacity (in dwt)<br />
14.6%<br />
8.9% 8.5%<br />
0%<br />
0 ≤ 1500 1500-<br />
1999<br />
2000-<br />
2499<br />
2500-<br />
2999<br />
3000-<br />
3499<br />
3500-<br />
3999<br />
4000-<br />
4499<br />
4500-<br />
4999<br />
5000-<br />
5999<br />
6000-<br />
6999<br />
7000-<br />
7999<br />
≥ 8000<br />
Fig. 7<br />
Source: ISL Bremen (2006b).<br />
In the next three years, the supply of container ships will be increasing even more than<br />
dem<strong>and</strong>. At the beginning of 2006, shipyard order books listed 1,230 ships with a container<br />
slot capacity of 4.45 mn TEU. The main emphasis was on large tonnage. With orders currently<br />
at h<strong>and</strong> for 3,514 ships with a total capacity of 8.14 mn TEU, this means that worldwide slot<br />
capacity will exp<strong>and</strong> by over 50% by 2009. In 2005 alone, the fleet capacity grew by 13.5%.<br />
The high rate of new ship construction has led to a decrease in the average age of the fleet, to<br />
approximately eleven years. Postpanamax ships, in fact, are on average less than five years old.<br />
The number of older ships that are scrapped will remain low. Surplus capacities in global<br />
container shipping seems inevitable beginning in 2010. 15<br />
Size – Continuous growth<br />
9.6%<br />
6.6%<br />
The rising volumes transported in regularly scheduled liner service can be tackled in two ways.<br />
Using additional ships with the same capacity can increase the transport frequency. Drawbacks<br />
are the very high investment volume, an increased capacity utilization risk for the service, <strong>and</strong><br />
an only minimal reduction in transport cost per container.<br />
15 See Clarkson Research Services (2006); ISL Bremen (2006b).<br />
94 Berenberg Bank · <strong>HWWI</strong>: Strategy 2030 · No. 4<br />
5.1%<br />
11.4%<br />
5.5%<br />
3.7%<br />
10.4%<br />
7.0%<br />
8.6%


