

Maritime Trade and Transport - HWWI
Maritime Trade and Transport - HWWI
Maritime Trade and Transport - HWWI

You also want an ePaper? Increase the reach of your titles
YUMPU automatically turns print PDFs into web optimized ePapers that Google loves.
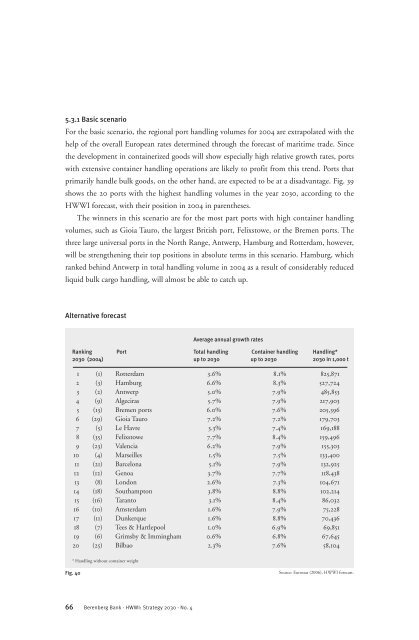
5.3.1 Basic scenario<br />
For the basic scenario, the regional port h<strong>and</strong>ling volumes for 2004 are extrapolated with the<br />
help of the overall European rates determined through the forecast of maritime trade. Since<br />
the development in containerized goods will show especially high relative growth rates, ports<br />
with extensive container h<strong>and</strong>ling operations are likely to profit from this trend. Ports that<br />
primarily h<strong>and</strong>le bulk goods, on the other h<strong>and</strong>, are expected to be at a disadvantage. Fig. 39<br />
shows the 20 ports with the highest h<strong>and</strong>ling volumes in the year 2030, according to the<br />
<strong>HWWI</strong> forecast, with their position in 2004 in parentheses.<br />
The winners in this scenario are for the most part ports with high container h<strong>and</strong>ling<br />
volumes, such as Gioia Tauro, the largest British port, Felixstowe, or the Bremen ports. The<br />
three large universal ports in the North Range, Antwerp, Hamburg <strong>and</strong> Rotterdam, however,<br />
will be strengthening their top positions in absolute terms in this scenario. Hamburg, which<br />
ranked behind Antwerp in total h<strong>and</strong>ling volume in 2004 as a result of considerably reduced<br />
liquid bulk cargo h<strong>and</strong>ling, will almost be able to catch up.<br />
Alternative forecast<br />
66 Berenberg Bank · <strong>HWWI</strong>: Strategy 2030 · No. 4<br />
Average annual growth rates<br />
Ranking Port Total h<strong>and</strong>ling Container h<strong>and</strong>ling H<strong>and</strong>ling*<br />
2030 (2004) up to 2030 up to 2030 2030 in 1,000 t<br />
1 (1) Rotterdam 3.6% 8.1% 825,871<br />
2 (3) Hamburg 6.6% 8.3% 527,724<br />
3 (2) Antwerp 5.0% 7.9% 485,853<br />
4 (9) Algeciras 5.7% 7.9% 217,903<br />
5 (13) Bremen ports 6.0% 7.6% 205,396<br />
6 (29) Gioia Tauro 7.2% 7.2% 179,703<br />
7 (5) Le Havre 3.3% 7.4% 169,188<br />
8 (35) Felixstowe 7.7% 8.4% 159,496<br />
9 (23) Valencia 6.2% 7.9% 155,303<br />
10 (4) Marseilles 1.5% 7.5% 133,400<br />
11 (21) Barcelona 5.1% 7.9% 132,925<br />
12 (12) Genoa 3.7% 7.7% 118,438<br />
13 (8) London 2.6% 7.3% 104,671<br />
14 (18) Southampton 3.8% 8.8% 102,214<br />
15 (16) Taranto 3.1% 8.4% 86,032<br />
16 (10) Amsterdam 1.6% 7.9% 75,228<br />
17 (11) Dunkerque 1.6% 8.8% 70,436<br />
18 (7) Tees & Hartlepool 1.0% 6.9% 69,851<br />
19 (6) Grimsby & Immingham 0.6% 6.8% 67,645<br />
20 (25) Bilbao 2.3% 7.6% 58,104<br />
* H<strong>and</strong>ling without container weight<br />
Fig. 40<br />
Source: Eurostat (2006), <strong>HWWI</strong> forecast.


