

Maritime Trade and Transport - HWWI
Maritime Trade and Transport - HWWI
Maritime Trade and Transport - HWWI

Create successful ePaper yourself
Turn your PDF publications into a flip-book with our unique Google optimized e-Paper software.
4. <strong>Maritime</strong> trade <strong>and</strong> port economics<br />
4.1 The European shipping areas 23<br />
Official EU statistics differentiate between four European sea areas: the Baltic Sea, North Sea,<br />
Atlantic <strong>and</strong> Mediterranean regions, whereby the term “shipping area” does not refer to the<br />
routes taken by the ships, but merely denotes a geographic delimitation. The four European<br />
sea areas comprise 471 ports in all, each of which h<strong>and</strong>les a total of more than 1 mn tons of<br />
cargo annually, as well as numerous smaller ports. Fig. 19 shows the 10 largest ports in the<br />
various shipping areas.<br />
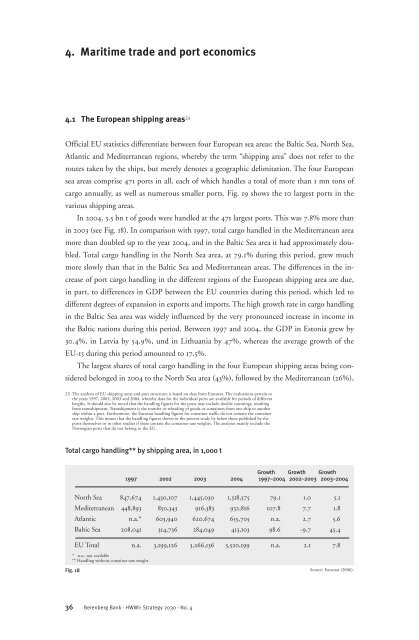
In 2004, 3.5 bn t of goods were h<strong>and</strong>led at the 471 largest ports. This was 7.8% more than<br />
in 2003 (see Fig. 18). In comparison with 1997, total cargo h<strong>and</strong>led in the Mediterranean area<br />
more than doubled up to the year 2004, <strong>and</strong> in the Baltic Sea area it had approximately doubled.<br />
Total cargo h<strong>and</strong>ling in the North Sea area, at 79.1% during this period, grew much<br />
more slowly than that in the Baltic Sea <strong>and</strong> Mediterranean areas. The differences in the increase<br />
of port cargo h<strong>and</strong>ling in the different regions of the European shipping area are due,<br />
in part, to differences in GDP between the EU countries during this period, which led to<br />
dif ferent degrees of expansion in exports <strong>and</strong> imports. The high growth rate in cargo h<strong>and</strong>ling<br />
in the Baltic Sea area was widely influenced by the very pronounced increase in income in<br />
the Baltic nations during this period. Between 1997 <strong>and</strong> 2004, the GDP in Estonia grew by<br />
30.4%, in Latvia by 54.9%, und in Lithuania by 47%, whereas the average growth of the<br />
EU-15 during this period amounted to 17.5%.<br />
The largest shares of total cargo h<strong>and</strong>ling in the four European shipping areas being considered<br />
belonged in 2004 to the North Sea area (43%), followed by the Mediterranean (26%),<br />
23 The analysis of EU shipping areas <strong>and</strong> port structures is based on data from Eurostat. The evaluations pertain to<br />
the years 1997, 2002, 2003 <strong>and</strong> 2004, whereby data for the individual ports are available for periods of different<br />
lengths. It should also be noted that the h<strong>and</strong>ling figures for the ports may include double countings, resulting<br />
from transshipment. Transshipment is the transfer or reloading of goods or containers from one ship to another<br />
ship within a port. Furthermore, the Eurostat h<strong>and</strong>ling figures for container traffic do not contain the container<br />
tare weights. This means that the h<strong>and</strong>ling figures shown in the present study lie below those published by the<br />
ports themselves or in other studies if these contain the container tare weights. The analyses mainly include the<br />
Norwegian ports that do not belong to the EU.<br />
Total cargo h<strong>and</strong>ling** by shipping area, in 1,000 t<br />
Growth Growth Growth<br />
1997 2002 2003 2004 1997–2004 2002–2003 2003–2004<br />
North Sea 847,674 1,430,107 1,445,030 1,518,575 79.1 1.0 5.1<br />
Mediterranean 448,893 850,343 916,383 932,816 107.8 7.7 1.8<br />
Atlantic n.a.* 603,940 620,674 655,705 n.a. 2.7 5.6<br />
Baltic Sea 208,041 314,736 284,049 413,103 98.6 -9.7 45.4<br />
EU Total n.a. 3,199,126 3,266,136 3,520,199 n.a. 2.1 7.8<br />
* n.a.: not available<br />
** H<strong>and</strong>ling without container tare weight<br />
Fig. 18<br />
36 Berenberg Bank · <strong>HWWI</strong>: Strategy 2030 · No. 4<br />
Source: Eurostat (2006).


