

Maritime Trade and Transport - HWWI
Maritime Trade and Transport - HWWI
Maritime Trade and Transport - HWWI

You also want an ePaper? Increase the reach of your titles
YUMPU automatically turns print PDFs into web optimized ePapers that Google loves.
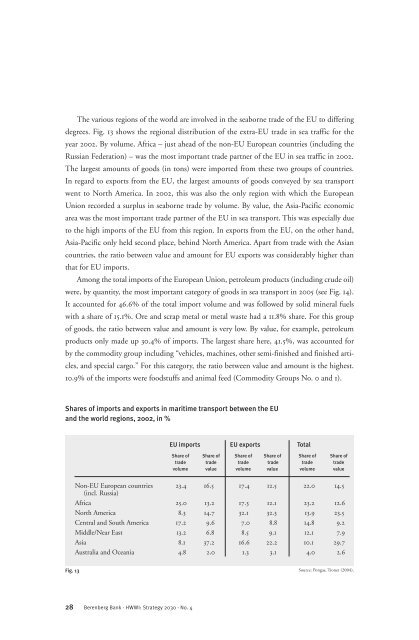
The various regions of the world are involved in the seaborne trade of the EU to differing<br />
degrees. Fig. 13 shows the regional distribution of the extra-EU trade in sea traffic for the<br />
year 2002. By volume, Africa – just ahead of the non-EU European countries (including the<br />
Russian Federation) – was the most important trade partner of the EU in sea traffic in 2002.<br />
The largest amounts of goods (in tons) were imported from these two groups of countries.<br />
In regard to exports from the EU, the largest amounts of goods conveyed by sea transport<br />
went to North America. In 2002, this was also the only region with which the European<br />
Union recorded a surplus in seaborne trade by volume. By value, the Asia-Pacific economic<br />
area was the most important trade partner of the EU in sea transport. This was especially due<br />
to the high imports of the EU from this region. In exports from the EU, on the other h<strong>and</strong>,<br />
Asia-Pacific only held second place, behind North America. Apart from trade with the Asian<br />
countries, the ratio between value <strong>and</strong> amount for EU exports was considerably higher than<br />
that for EU imports.<br />
Among the total imports of the European Union, petroleum products (including crude oil)<br />
were, by quantity, the most important category of goods in sea transport in 2005 (see Fig. 14).<br />
It accounted for 46.6% of the total import volume <strong>and</strong> was followed by solid mineral fuels<br />
with a share of 15.1%. Ore <strong>and</strong> scrap metal or metal waste had a 11.8% share. For this group<br />
of goods, the ratio between value <strong>and</strong> amount is very low. By value, for example, petroleum<br />
products only made up 30.4% of imports. The largest share here, 41.5%, was accounted for<br />
by the commodity group including “vehicles, machines, other semi-finished <strong>and</strong> finished articles,<br />
<strong>and</strong> special cargo.” For this category, the ratio between value <strong>and</strong> amount is the highest.<br />
10.9% of the imports were foodstuffs <strong>and</strong> animal feed (Commodity Groups No. 0 <strong>and</strong> 1).<br />
Shares of imports <strong>and</strong> exports in maritime transport between the EU<br />
<strong>and</strong> the world regions, 2002, in %<br />
Fig. 13<br />
28 Berenberg Bank · <strong>HWWI</strong>: Strategy 2030 · No. 4<br />
EU imports EU exports Total<br />
Share of Share of Share of Share of Share of Share of<br />
trade trade trade trade trade trade<br />
volume value volume value volume value<br />
Non-EU European countries 23.4 16.5 17.4 12.5 22.0 14.5<br />
(incl. Russia)<br />
Africa 25.0 13.2 17.3 12.1 23.2 12.6<br />
North America 8.3 14.7 32.1 32.3 13.9 23.5<br />
Central <strong>and</strong> South America 17.2 9.6 7.0 8.8 14.8 9.2<br />
Middle/Near East 13.2 6.8 8.5 9.1 12.1 7.9<br />
Asia 8.1 37.2 16.6 22.2 10.1 29.7<br />
Australia <strong>and</strong> Oceania 4.8 2.0 1.3 3.1 4.0 2.6<br />
Source: Pongas, Tronet (2004).


