

Maritime Trade and Transport - HWWI
Maritime Trade and Transport - HWWI
Maritime Trade and Transport - HWWI

You also want an ePaper? Increase the reach of your titles
YUMPU automatically turns print PDFs into web optimized ePapers that Google loves.
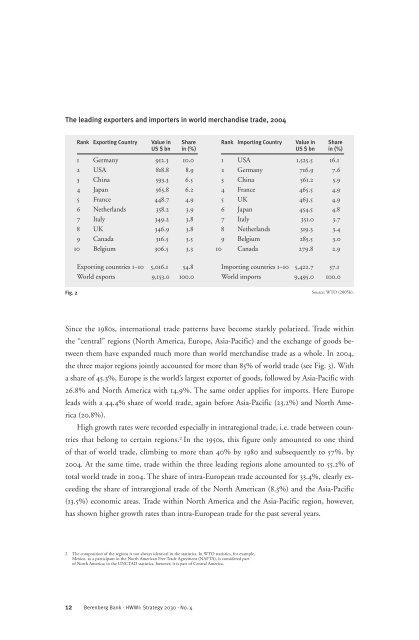
The leading exporters <strong>and</strong> importers in world merch<strong>and</strong>ise trade, 2004<br />
Rank Exporting Country Value in Share Rank Importing Country Value in Share<br />
US $ bn in (%) US $ bn in (%)<br />
1 Germany 912.3 10.0 1 USA 1,525.5 16.1<br />
2 USA 818.8 8.9 2 Germany 716.9 7.6<br />
3 China 593.3 6.5 3 China 561.2 5.9<br />
4 Japan 565.8 6.2 4 France 465.5 4.9<br />
5 France 448.7 4.9 5 UK 463.5 4.9<br />
6 Netherl<strong>and</strong>s 358.2 3.9 6 Japan 454.5 4.8<br />
7 Italy 349.2 3.8 7 Italy 351.0 3.7<br />
8 UK 346.9 3.8 8 Netherl<strong>and</strong>s 319.3 3.4<br />
9 Canada 316.5 3.5 9 Belgium 285.5 3.0<br />
10 Belgium 306.5 3.3 10 Canada 279.8 2.9<br />
Fig. 2<br />
Exporting countries 1‒10 5,016.1 54.8 Importing countries 1‒10 5,422.7 57.1<br />
World exports 9,153.0 100.0 World imports 9,495.0 100.0<br />
Since the 1980s, international trade patterns have become starkly polarized. <strong>Trade</strong> within<br />
the “central” regions (North America, Europe, Asia-Pacific) <strong>and</strong> the exchange of goods between<br />
them have exp<strong>and</strong>ed much more than world merch<strong>and</strong>ise trade as a whole. In 2004,<br />
the three major regions jointly accounted for more than 85% of world trade (see Fig. 3). With<br />
a share of 45.3%, Europe is the world’s largest exporter of goods, followed by Asia-Pacific with<br />
26.8% <strong>and</strong> North America with 14.9%. The same order applies for imports. Here Europe<br />
leads with a 44.4% share of world trade, again before Asia-Pacific (23.2%) <strong>and</strong> North America<br />
(20.8%).<br />
High growth rates were recorded especially in intraregional trade, i.e. trade between countries<br />
that belong to certain regions. 2 In the 1950s, this figure only amounted to one third<br />
of that of world trade, climbing to more than 40% by 1980 <strong>and</strong> subsequently to 57%. by<br />
2004. At the same time, trade within the three leading regions alone amounted to 55.2% of<br />
total world trade in 2004. The share of intra-European trade accounted for 33.4%, clearly ex -<br />
ceeding the share of intraregional trade of the North American (8.3%) <strong>and</strong> the Asia-Pacific<br />
(13.5%) economic areas. <strong>Trade</strong> within North America <strong>and</strong> the Asia-Pacific region, however,<br />
has shown higher growth rates than intra-European trade for the past several years.<br />
2 The composition of the regions is not always identical in the statistics. In WTO statistics, for example,<br />
Mexico, as a participant in the North American Free <strong>Trade</strong> Agreement (NAFTA), is considered part<br />
of North America; in the UNCTAD statistics, however, it is part of Central America.<br />
12 Berenberg Bank · <strong>HWWI</strong>: Strategy 2030 · No. 4<br />
Source: WTO (2005b).


