

Maritime Trade and Transport - HWWI
Maritime Trade and Transport - HWWI
Maritime Trade and Transport - HWWI

Create successful ePaper yourself
Turn your PDF publications into a flip-book with our unique Google optimized e-Paper software.
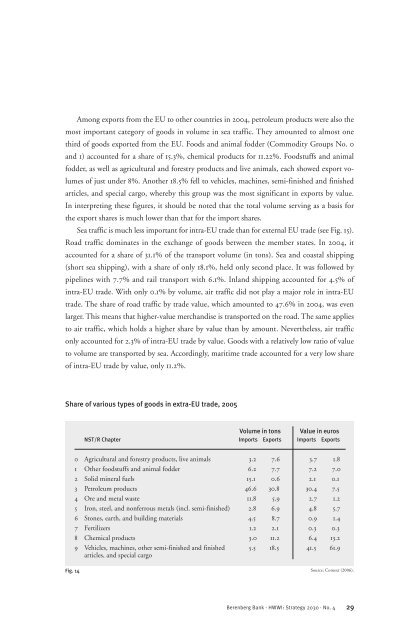
Among exports from the EU to other countries in 2004, petroleum products were also the<br />
most important category of goods in volume in sea traffic. They amounted to almost one<br />
third of goods exported from the EU. Foods <strong>and</strong> animal fodder (Commodity Groups No. 0<br />
<strong>and</strong> 1) accounted for a share of 15.3%, chemical products for 11.22%. Foodstuffs <strong>and</strong> animal<br />
fodder, as well as agricultural <strong>and</strong> forestry products <strong>and</strong> live animals, each showed export volu<br />
mes of just under 8%. Another 18.5% fell to vehicles, machines, semi-finished <strong>and</strong> finished<br />
articles, <strong>and</strong> special cargo, whereby this group was the most significant in exports by value.<br />
In interpreting these figures, it should be noted that the total volume serving as a basis for<br />
the export shares is much lower than that for the import shares.<br />
Sea traffic is much less important for intra-EU trade than for external EU trade (see Fig. 15).<br />
Road traffic dominates in the exchange of goods between the member states. In 2004, it<br />
accounted for a share of 31.1% of the transport volume (in tons). Sea <strong>and</strong> coastal shipping<br />
(short sea shipping), with a share of only 18.1%, held only second place. It was followed by<br />
pipelines with 7.7% <strong>and</strong> rail transport with 6.1%. Inl<strong>and</strong> shipping accounted for 4.5% of<br />
intra-EU trade. With only 0.1% by volume, air traffic did not play a major role in intra-EU<br />
trade. The share of road traffic by trade value, which amounted to 47.6% in 2004, was even<br />
larger. This means that higher-value merch<strong>and</strong>ise is transported on the road. The same applies<br />
to air traffic, which holds a higher share by value than by amount. Nevertheless, air traffic<br />
only accounted for 2.3% of intra-EU trade by value. Goods with a relatively low ratio of value<br />
to volume are transported by sea. Accordingly, maritime trade accounted for a very low share<br />
of intra-EU trade by value, only 11.2%.<br />
Share of various types of goods in extra-EU trade, 2005<br />
Fig. 14<br />
Volume in tons Value in euros<br />
NST/R Chapter Imports Exports Imports Exports<br />
0 Agricultural <strong>and</strong> forestry products, live animals 3.2 7.6 3.7 1.8<br />
1 Other foodstuffs <strong>and</strong> animal fodder 6.2 7.7 7.2 7.0<br />
2 Solid mineral fuels 15.1 0.6 2.1 0.1<br />
3 Petroleum products 46.6 30.8 30.4 7.5<br />
4 Ore <strong>and</strong> metal waste 11.8 5.9 2.7 1.2<br />
5 Iron, steel, <strong>and</strong> nonferrous metals (incl. semi-finished) 2.8 6.9 4.8 5.7<br />
6 Stones, earth, <strong>and</strong> building materials 4.5 8.7 0.9 1.4<br />
7 Fertilizers 1.2 2.1 0.3 0.3<br />
8 Chemical products 3.0 11.2 6.4 13.2<br />
9 Vehicles, machines, other semi-finished <strong>and</strong> finished 5.5 18.5 41.5 61.9<br />
articles, <strong>and</strong> special cargo<br />
Source: Comext (2006).<br />
Berenberg Bank · <strong>HWWI</strong>: Strategy 2030 · No. 4<br />
29


