

Maritime Trade and Transport - HWWI
Maritime Trade and Transport - HWWI
Maritime Trade and Transport - HWWI

You also want an ePaper? Increase the reach of your titles
YUMPU automatically turns print PDFs into web optimized ePapers that Google loves.
eached 1.6% annually between 1985 <strong>and</strong> 1990. In contrast, growth in the transport volume of<br />
crude oil <strong>and</strong> oil products had weakened over time. However, this only held true up to 2002.<br />
Since 2003 – due to dem<strong>and</strong> from China – a definite boost in growth rates has been observed.<br />
Since 2000, iron ore has shown the highest growth rate in total cargo shipments, 8.4%<br />
annually (1985-2005: 4% annually). This made it possible to reverse the downward trend in<br />
total shipments for iron ore that had persisted since 1985 (see Fig. 9). The same holds true for<br />
coal transports by sea. The growth rates for the items grouped under the collective expression<br />
“other goods” increased considerably between 1985 <strong>and</strong> 2000. From 2000 to 2005, however,<br />
the expansion was less marked than beforeh<strong>and</strong>. The vigorous growth in container transport<br />
was to a great extent responsible for the generally high increase in the transport of other goods.<br />
On the other h<strong>and</strong>, growth in total shipments for crude oil has weakened considerably since<br />
1985. This indicates that crude oil transported by sea in the past 15 years was conveyed over<br />
short distances.<br />
A consideration of seagoing world trade by region shows that Asia-Pacific, Europe (even<br />
without the Central <strong>and</strong> Eastern European countries) <strong>and</strong> North America are the most im -<br />
portant destination regions for maritime trade (see Fig. 10). The goods that were unloaded<br />
amounted altogether to a share of 87.4%, whereby 42.4% of this fell to the Asia-Pacific trade<br />
region alone. For loaded goods, seaborne trade was much more evenly distributed among the<br />
individual regions. Here, too, Asia-Pacific led with 31.1%. In second place was Europe at<br />
17.5%, followed by the Middle East (16.0%), Central <strong>and</strong> South America (13.5%) <strong>and</strong> Africa<br />
(8.6%). In loaded goods, North America only accounted for a share of 7.9%. Behind it was<br />
only the Commonwealth of Independent States (including the Central <strong>and</strong> Eastern European<br />
countries) with 5.1%. It is striking that there were great deviations in all regions between the<br />
amounts of goods that were loaded <strong>and</strong> those that were unloaded.<br />
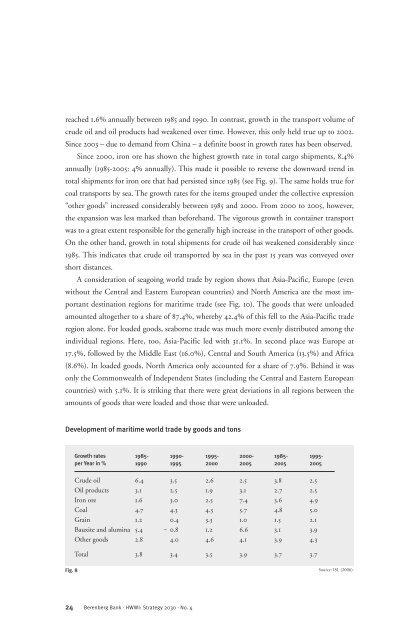
Development of maritime world trade by goods <strong>and</strong> tons<br />
Fig. 8<br />
Growth rates 1985- 1990- 1995- 2000- 1985- 1995per<br />
Year in % 1990 1995 2000 2005 2005 2005<br />
Crude oil 6.4 3.5 2.6 2.5 3.8 2.5<br />
Oil products 3.1 2.5 1.9 3.1 2.7 2.5<br />
Iron ore 1.6 3.0 2.5 7.4 3.6 4.9<br />
Coal 4.7 4.3 4.3 5.7 4.8 5.0<br />
Grain 1.2 0.4 3.3 1.0 1.5 2.1<br />
Bauxite <strong>and</strong> alumina 5.4 ‒ 0.8 1.2 6.6 3.1 3.9<br />
Other goods 2.8 4.0 4.6 4.1 3.9 4.3<br />
Total 3.8 3.4 3.5 3.9 3.7 3.7<br />
24 Berenberg Bank · <strong>HWWI</strong>: Strategy 2030 · No. 4<br />
Source: ISL (2006).


