

Maritime Trade and Transport - HWWI
Maritime Trade and Transport - HWWI
Maritime Trade and Transport - HWWI

You also want an ePaper? Increase the reach of your titles
YUMPU automatically turns print PDFs into web optimized ePapers that Google loves.
2004 amounted in Wilhelmshaven to 95%, in Amsterdam to 35%, <strong>and</strong> in Antwerp to 25%.<br />
The specialization of ports is also relevant to the differing growth rates of the port locations,<br />
since growth rates in container trade are much higher than those of trade in bulk goods. This<br />
explains, for example, the appreciable difference in growth between Rotterdam <strong>and</strong> Hamburg<br />
between 1997 <strong>and</strong> 2004. Whereas the share of container trade in Hamburg is approximately<br />
60% of total h<strong>and</strong>ling, Rotterdam includes a much higher share of bulk goods than<br />
Ham burg.<br />
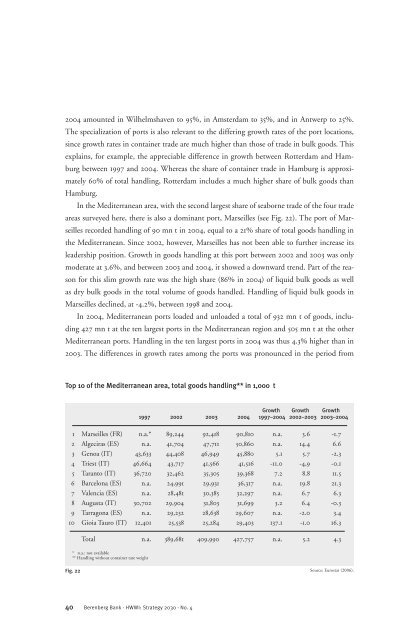
In the Mediterranean area, with the second largest share of seaborne trade of the four trade<br />
areas surveyed here, there is also a dominant port, Marseilles (see Fig. 22). The port of Mar -<br />
seilles recorded h<strong>and</strong>ling of 90 mn t in 2004, equal to a 21% share of total goods h<strong>and</strong>ling in<br />
the Mediterranean. Since 2002, however, Marseilles has not been able to further increase its<br />
leadership position. Growth in goods h<strong>and</strong>ling at this port between 2002 <strong>and</strong> 2003 was only<br />
moderate at 3.6%, <strong>and</strong> between 2003 <strong>and</strong> 2004, it showed a downward trend. Part of the reason<br />
for this slim growth rate was the high share (86% in 2004) of liquid bulk goods as well<br />
as dry bulk goods in the total volume of goods h<strong>and</strong>led. H<strong>and</strong>ling of liquid bulk goods in<br />
Marseilles declined, at -4.2%, between 1998 <strong>and</strong> 2004.<br />
In 2004, Mediterranean ports loaded <strong>and</strong> unloaded a total of 932 mn t of goods, including<br />
427 mn t at the ten largest ports in the Mediterranean region <strong>and</strong> 505 mn t at the other<br />
Mediterranean ports. H<strong>and</strong>ling in the ten largest ports in 2004 was thus 4.3% higher than in<br />
2003. The differences in growth rates among the ports was pronounced in the period from<br />
Top 10 of the Mediterranean area, total goods h<strong>and</strong>ling** in 1,000 t<br />
40 Berenberg Bank · <strong>HWWI</strong>: Strategy 2030 · No. 4<br />
Growth Growth Growth<br />
1997 2002 2003 2004 1997–2004 2002–2003 2003–2004<br />
1 Marseilles (FR) n.a.* 89,244 92,418 90,810 n.a. 3.6 -1.7<br />
2 Algeciras (ES) n.a. 41,704 47,711 50,860 n.a. 14.4 6.6<br />
3 Genoa (IT) 43,633 44,408 46,949 45,880 5.1 5.7 -2.3<br />
4 Triest (IT) 46,664 43,717 41,566 41,516 -11.0 -4,9 -0.1<br />
5 Taranto (IT) 36,720 32,462 35,305 39,368 7.2 8.8 11.5<br />
6 Barcelona (ES) n.a. 24,991 29,931 36,317 n.a. 19.8 21.3<br />
7 Valencia (ES) n.a. 28,481 30,385 32,297 n.a. 6.7 6.3<br />
8 Augusta (IT) 30,702 29,904 31,803 31,699 3.2 6.4 -0.3<br />
9 Tarragona (ES) n.a. 29,232 28,638 29,607 n.a. -2.0 3.4<br />
10 Gioia Tauro (IT) 12,401 25,538 25,284 29,403 137.1 -1.0 16.3<br />
Total n.a. 389,681 409,990 427,757 n.a. 5.2 4.3<br />
* n.a.: not available<br />
** H<strong>and</strong>ling without container tare weight<br />
Fig. 22<br />
Source: Eurostat (2006).


