

Maritime Trade and Transport - HWWI
Maritime Trade and Transport - HWWI
Maritime Trade and Transport - HWWI

You also want an ePaper? Increase the reach of your titles
YUMPU automatically turns print PDFs into web optimized ePapers that Google loves.
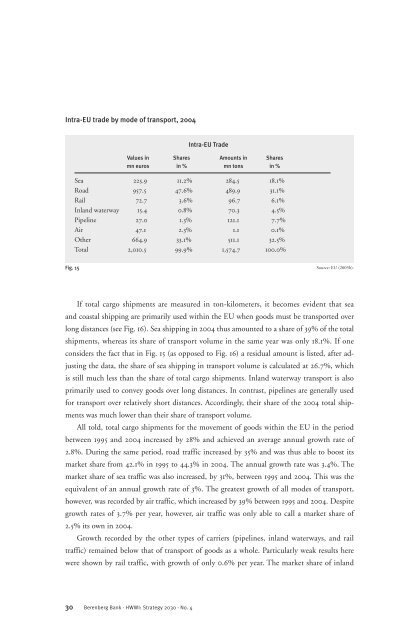
Intra-EU trade by mode of transport, 2004<br />
If total cargo shipments are measured in ton-kilometers, it becomes evident that sea<br />
<strong>and</strong> coastal shipping are primarily used within the EU when goods must be transported over<br />
long distances (see Fig. 16). Sea shipping in 2004 thus amounted to a share of 39% of the total<br />
shipments, whereas its share of transport volume in the same year was only 18.1%. If one<br />
considers the fact that in Fig. 15 (as opposed to Fig. 16) a residual amount is listed, after adjusting<br />
the data, the share of sea shipping in transport volume is calculated at 26.7%, which<br />
is still much less than the share of total cargo shipments. Inl<strong>and</strong> waterway transport is also<br />
primarily used to convey goods over long distances. In contrast, pipelines are generally used<br />
for transport over relatively short distances. Accordingly, their share of the 2004 total shipments<br />
was much lower than their share of transport volume.<br />
All told, total cargo shipments for the movement of goods within the EU in the period<br />
between 1995 <strong>and</strong> 2004 increased by 28% <strong>and</strong> achieved an average annual growth rate of<br />
2.8%. During the same period, road traffic increased by 35% <strong>and</strong> was thus able to boost its<br />
market share from 42.1% in 1995 to 44.3% in 2004. The annual growth rate was 3.4%. The<br />
market share of sea traffic was also increased, by 31%, between 1995 <strong>and</strong> 2004. This was the<br />
equivalent of an annual growth rate of 3%. The greatest growth of all modes of transport,<br />
however, was recorded by air traffic, which increased by 39% between 1995 <strong>and</strong> 2004. Despite<br />
growth rates of 3.7% per year, however, air traffic was only able to call a market share of<br />
2.5% its own in 2004.<br />
Growth recorded by the other types of carriers (pipelines, inl<strong>and</strong> waterways, <strong>and</strong> rail<br />
traffic) remained below that of transport of goods as a whole. Particularly weak results here<br />
were shown by rail traffic, with growth of only 0.6% per year. The market share of inl<strong>and</strong><br />
30 Berenberg Bank · <strong>HWWI</strong>: Strategy 2030 · No. 4<br />
Intra-EU <strong>Trade</strong><br />
Values in Shares Amounts in Shares<br />
mn euros in % mn tons in %<br />
Sea 225.9 11.2% 284.5 18.1%<br />
Road 957.5 47.6% 489.9 31.1%<br />
Rail 72.7 3.6% 96.7 6.1%<br />
Inl<strong>and</strong> waterway 15.4 0.8% 70.3 4.5%<br />
Pipeline 27.0 1.3% 121.1 7.7%<br />
Air 47.1 2.3% 1.1 0.1%<br />
Other 664.9 33.1% 511.1 32.5%<br />
Total 2,010.5 99.9% 1,574.7 100.0%<br />
Fig. 15 Source: EU (2005b).


