

Maritime Trade and Transport - HWWI
Maritime Trade and Transport - HWWI
Maritime Trade and Transport - HWWI

Create successful ePaper yourself
Turn your PDF publications into a flip-book with our unique Google optimized e-Paper software.
of total goods h<strong>and</strong>ling in Le Havre. On the other h<strong>and</strong>, growth in container trade between<br />
1998 <strong>and</strong> 2004 was 80%. This only minimally affected growth in total cargo h<strong>and</strong>ling during<br />
this period, because container trade only accounts for 25% of overall h<strong>and</strong>ling in Le Havre.<br />
In the Atlantic area, as in the North Sea region, the UK ports are highly significant, with a<br />
h<strong>and</strong>ling volume of 129 mn t in 2004. The French ports, on the other h<strong>and</strong>, recorded total<br />
cargo h<strong>and</strong>ling of 143 mn t in 2004. Between 2003 <strong>and</strong> 2004, growth at the four French ports<br />
was 5.2 percentage points lower than that of the four top British ports.<br />
The ports in the new EU countries in the Baltic Sea area – Pol<strong>and</strong>, Estonia, Latvia <strong>and</strong><br />
Lithuania – only began developing significant trade relationships with Western Europe in<br />
the early 1990s. In the course of the exp<strong>and</strong>ing trade relations between Eastern <strong>and</strong> Western<br />
Europe, certain port sites in the Baltic Sea region have grown immensely. Today the first five<br />
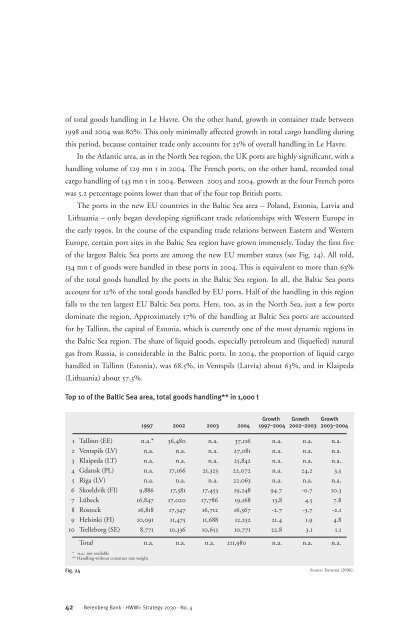
of the largest Baltic Sea ports are among the new EU member states (see Fig. 24). All told,<br />
134 mn t of goods were h<strong>and</strong>led in these ports in 2004. This is equivalent to more than 63%<br />
of the total goods h<strong>and</strong>led by the ports in the Baltic Sea region. In all, the Baltic Sea ports<br />
account for 12% of the total goods h<strong>and</strong>led by EU ports. Half of the h<strong>and</strong>ling in this region<br />
falls to the ten largest EU Baltic Sea ports. Here, too, as in the North Sea, just a few ports<br />
dominate the region. Approximately 17% of the h<strong>and</strong>ling at Baltic Sea ports are accounted<br />
for by Tallinn, the capital of Estonia, which is currently one of the most dynamic regions in<br />
the Baltic Sea region. The share of liquid goods, especially petroleum <strong>and</strong> (liquefied) natural<br />
gas from Russia, is considerable in the Baltic ports. In 2004, the proportion of liquid cargo<br />
h<strong>and</strong>led in Tallinn (Estonia), was 68.5%, in Ventspils (Latvia) about 63%, <strong>and</strong> in Klaipeda<br />
(Lithuania) about 57.3%.<br />
Top 10 of the Baltic Sea area, total goods h<strong>and</strong>ling** in 1,000 t<br />
42 Berenberg Bank · <strong>HWWI</strong>: Strategy 2030 · No. 4<br />
Growth Growth Growth<br />
1997 2002 2003 2004 1997–2004 2002–2003 2003–2004<br />
1 Tallinn (EE) n.a.* 36,480 n.a. 37,116 n.a. n.a. n.a.<br />
2 Ventspils (LV) n.a. n.a. n.a. 27,081 n.a. n.a. n.a.<br />
3 Klaipeda (LT) n.a. n.a. n.a. 25,842 n.a. n.a. n.a.<br />
4 Gdansk (PL) n.a. 17,166 21,323 22,072 n.a. 24,2 3,5<br />
5 Riga (LV) n.a. n.a. n.a. 22,063 n.a. n.a. n.a.<br />
6 Skoeldvik (FI) 9,886 17,581 17,453 19,248 94.7 -0.7 10.3<br />
7 Lübeck 16,847 17,020 17,786 19,168 13,8 4.5 7.8<br />
8 Rostock 16,818 17,347 16,712 16,367 -2.7 -3.7 -2.1<br />
9 Helsinki (FI) 10,091 11,475 11,688 12,252 21.4 1.9 4.8<br />
10 Trelleborg (SE) 8,771 10,336 10,655 10,771 22.8 3.1 1.1<br />
Total n.a. n.a. n.a. 211,980 n.a. n.a. n.a.<br />
* n.a.: not available<br />
** H<strong>and</strong>ling without container tare weight<br />
Fig. 24<br />
Source: Eurostat (2006).


