

Maritime Trade and Transport - HWWI
Maritime Trade and Transport - HWWI
Maritime Trade and Transport - HWWI

Create successful ePaper yourself
Turn your PDF publications into a flip-book with our unique Google optimized e-Paper software.
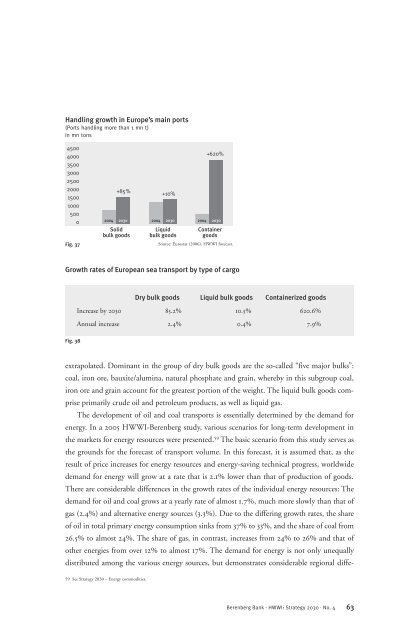
H<strong>and</strong>ling growth in Europe’s main ports<br />
(Ports h<strong>and</strong>ling more than 1 mn t)<br />
in mn tons<br />
4500<br />
4000<br />
3500<br />
3000<br />
2500<br />
2000<br />
1500<br />
1000<br />
500<br />
0<br />
Fig. 37<br />
Fig. 38<br />
+85%<br />
2004 2030 2004 2030 2004 2030<br />
Solid Liquid Container<br />
bulk goods bulk goods goods<br />
Source: Eurostat (2006), <strong>HWWI</strong> forecast.<br />
Growth rates of European sea transport by type of cargo<br />
Dry bulk goods Liquid bulk goods Containerized goods<br />
Increase by 2030 85.2% 10.5% 620.6%<br />
Annual increase 2.4% 0.4% 7.9%<br />
extrapolated. Dominant in the group of dry bulk goods are the so-called “five major bulks”:<br />
coal, iron ore, bauxite/alumina, natural phosphate <strong>and</strong> grain, whereby in this subgroup coal,<br />
iron ore <strong>and</strong> grain account for the greatest portion of the weight. The liquid bulk goods comprise<br />
primarily crude oil <strong>and</strong> petroleum products, as well as liquid gas.<br />
The development of oil <strong>and</strong> coal transports is essentially determined by the dem<strong>and</strong> for<br />
energy. In a 2005 <strong>HWWI</strong>-Berenberg study, various scenarios for long-term development in<br />
the markets for energy resources were presented. 59 The basic scenario from this study serves as<br />
the grounds for the forecast of transport volume. In this forecast, it is assumed that, as the<br />
result of price increases for energy resources <strong>and</strong> energy-saving technical progress, worldwide<br />
dem<strong>and</strong> for energy will grow at a rate that is 2.1% lower than that of production of goods.<br />
There are considerable differences in the growth rates of the individual energy resources: The<br />
dem<strong>and</strong> for oil <strong>and</strong> coal grows at a yearly rate of almost 1.7%, much more slowly than that of<br />
gas (2.4%) <strong>and</strong> alternative energy sources (3.3%). Due to the differing growth rates, the share<br />
of oil in total primary energy consumption sinks from 37% to 33%, <strong>and</strong> the share of coal from<br />
26.5% to almost 24%. The share of gas, in contrast, increases from 24% to 26% <strong>and</strong> that of<br />
other energies from over 12% to almost 17%. The dem<strong>and</strong> for energy is not only unequally<br />
distributed among the various energy sources, but demonstrates considerable regional diffe-<br />
59 See Strategy 2030 – Energy commodities.<br />
+10%<br />
+620%<br />
Berenberg Bank · <strong>HWWI</strong>: Strategy 2030 · No. 4<br />
63


