

Maritime Trade and Transport - HWWI
Maritime Trade and Transport - HWWI
Maritime Trade and Transport - HWWI

You also want an ePaper? Increase the reach of your titles
YUMPU automatically turns print PDFs into web optimized ePapers that Google loves.
portant customers for coal in 2004. The primary suppliers of grain in 2004 were the USA<br />
with 45.6%, South America with 22.5%, <strong>and</strong> Australia with 10.4%. Here, too, the largest<br />
amount was shipped to countries in the Far East (41.1%). 16<br />
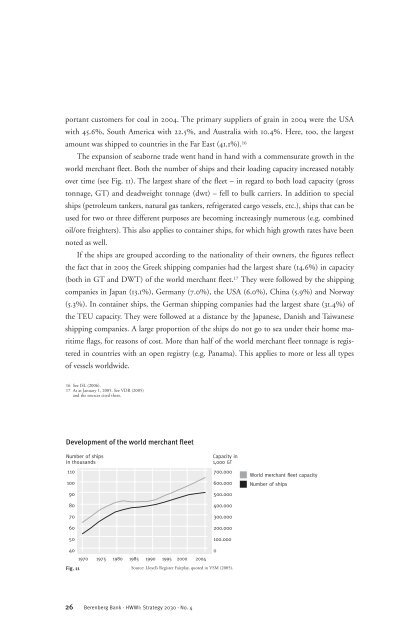
The expansion of seaborne trade went h<strong>and</strong> in h<strong>and</strong> with a commensurate growth in the<br />
world merchant fleet. Both the number of ships <strong>and</strong> their loading capacity increased notably<br />
over time (see Fig. 11). The largest share of the fleet – in regard to both load capacity (gross<br />
tonnage, GT) <strong>and</strong> deadweight tonnage (dwt) – fell to bulk carriers. In addition to special<br />
ships (petroleum tankers, natural gas tankers, refrigerated cargo vessels, etc.), ships that can be<br />
used for two or three different purposes are becoming increasingly numerous (e.g. combined<br />
oil/ore freighters). This also applies to container ships, for which high growth rates have been<br />
noted as well.<br />
If the ships are grouped according to the nationality of their owners, the figures reflect<br />
the fact that in 2005 the Greek shipping companies had the largest share (14.6%) in capacity<br />
(both in GT <strong>and</strong> DWT) of the world merchant fleet. 17 They were followed by the shipping<br />
companies in Japan (13.1%), Germany (7.0%), the USA (6.0%), China (5.9%) <strong>and</strong> Norway<br />
(5.3%). In container ships, the German shipping companies had the largest share (31.4%) of<br />
the TEU capacity. They were followed at a distance by the Japanese, Danish <strong>and</strong> Taiwanese<br />
shipping companies. A large proportion of the ships do not go to sea under their home maritime<br />
flags, for reasons of cost. More than half of the world merchant fleet tonnage is regis -<br />
tered in countries with an open registry (e.g. Panama). This applies to more or less all types<br />
of vessels worldwide.<br />
16 See ISL (2006).<br />
17 As at January 1, 2005. See VDR (2005)<br />
<strong>and</strong> the sources cited there.<br />
Development of the world merchant fleet<br />
Number of ships Capacity in<br />
in thous<strong>and</strong>s 1,000 GT<br />
110<br />
700.000<br />
100<br />
600.000<br />
90<br />
500.000<br />
80<br />
400.000<br />
70<br />
300.000<br />
60<br />
200.000<br />
50<br />
100.000<br />
40<br />
1970 1975 1980 1985 1990 1995 2000 2004<br />
0<br />
Fig. 11<br />
Source: Lloyd’s Register Fairplay, quoted in VSM (2005).<br />
26 Berenberg Bank · <strong>HWWI</strong>: Strategy 2030 · No. 4<br />
World merchant fleet capacity<br />
Number of ships


