

Maritime Trade and Transport - HWWI
Maritime Trade and Transport - HWWI
Maritime Trade and Transport - HWWI

Create successful ePaper yourself
Turn your PDF publications into a flip-book with our unique Google optimized e-Paper software.
300<br />
250<br />
200<br />
150<br />
100<br />
50<br />
frastructure spending to 1.4% of the GDP has accelerated the aging of such infrastructure. In<br />
Europe, driven by the enlargement of the EU <strong>and</strong> the common currency, €600 bn has been<br />
assessed just for the expansion of the trans-European traffic network up to 2020. 85<br />
0<br />
7.1.2.2 Asia – Growth engine for infrastructure<br />
The Asian emerging nations constitute the growth center for the construction of new transport<br />
infrastructure. With investment quotas averaging 3% of the GDP, ratios are created that go<br />
far beyond those of the industrialized nations. Growth will remain brisk in the medium term.<br />
Annual investment requirements of $211 bn are expected for Asia until 2010, to escalate to<br />
$262 bn by 2015. These figures make the estimates of global investment volumes appear too low.<br />
The World Bank envisions the emergence of a financing gap of $180-220 bn for Asia. 86<br />
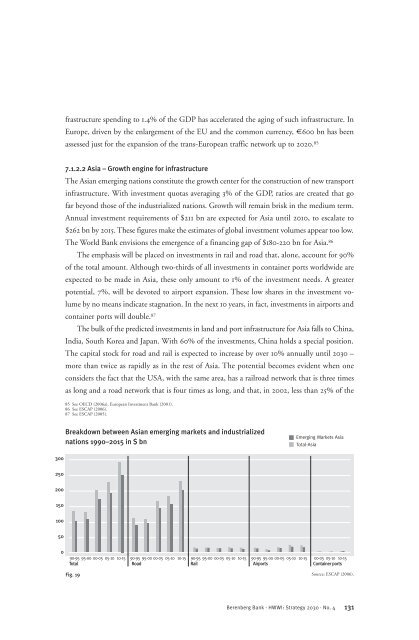
The emphasis will be placed on investments in rail <strong>and</strong> road that, alone, account for 90%<br />
of the total amount. Although two-thirds of all investments in container ports worldwide are<br />
expected to be made in Asia, these only amount to 1% of the investment needs. A greater<br />
potential, 7%, will be devoted to airport expansion. These low shares in the investment volume<br />
by no means indicate stagnation. In the next 10 years, in fact, investments in airports <strong>and</strong><br />
container ports will double. 87<br />
The bulk of the predicted investments in l<strong>and</strong> <strong>and</strong> port infrastructure for Asia falls to China,<br />
India, South Korea <strong>and</strong> Japan. With 60% of the investments, China holds a special position.<br />
The capital stock for road <strong>and</strong> rail is expected to increase by over 10% annually until 2030 –<br />
more than twice as rapidly as in the rest of Asia. The potential becomes evident when one<br />
considers the fact that the USA, with the same area, has a railroad network that is three times<br />
as long <strong>and</strong> a road network that is four times as long, <strong>and</strong> that, in 2002, less than 25% of the<br />
85 See OECD (2006a), European Investment Bank (2001).<br />
86 See ESCAP (2006).<br />
87 See ESCAP (2005).<br />
Breakdown between Asian emerging markets <strong>and</strong> industrialized<br />
nations 1990–2015 in $ bn<br />
Emerging Markets Asia<br />
Total-Asia<br />
90-95 95-00 00-05 05-10 10-15 90-95 95-00 00-05 05-10 10-15 90-95 95-00 00-05 05-10 10-15 90-95 95-00 00-05 05-10 10-15 00-05 05-10 10-15<br />
Total Road Rail Airports Container ports<br />
Fig. 19<br />
Source: ESCAP (2006).<br />
Berenberg Bank · <strong>HWWI</strong>: Strategy 2030 · No. 4<br />
131


