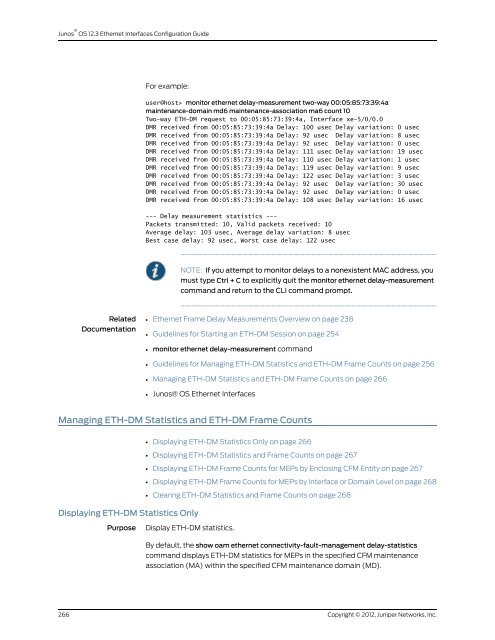
- Page 1 and 2:
Junos ® OS Ethernet Interfaces Con
- Page 3 and 4:
Abbreviated Table of Contents About
- Page 5 and 6:
Table of Contents About This Guide
- Page 7 and 8:
Configuring Extended VLAN Encapsula
- Page 9 and 10:
Configuring LACP System Identifier
- Page 11 and 12:
Copyright © 2012, Juniper Networks
- Page 13 and 14:
ETH-DM Frame Count Retrieval . . .
- Page 15 and 16:
Chapter 20 Configuring Gigabit Ethe
- Page 17 and 18:
Copyright © 2012, Juniper Networks
- Page 19 and 20:
Copyright © 2012, Juniper Networks
- Page 21 and 22:
static-interface . . . . . . . . .
- Page 23 and 24:
List of Figures Part 2 Configuring
- Page 25 and 26:
List of Tables About This Guide . .
- Page 27 and 28:
About This Guide This preface provi
- Page 29 and 30:
Using the Indexes • MX Series •
- Page 31 and 32:
Table 1: Notice Icons Icon Meaning
- Page 33 and 34:
or are covered under warranty, and
- Page 35 and 36:
PART 1 Ethernet Interfaces Configur
- Page 37 and 38:
CHAPTER 1 Ethernet Interfaces Confi
- Page 39 and 40:
Copyright © 2012, Juniper Networks
- Page 41 and 42:
Copyright © 2012, Juniper Networks
- Page 43 and 44:
Copyright © 2012, Juniper Networks
- Page 45 and 46:
Copyright © 2012, Juniper Networks
- Page 47 and 48:
Copyright © 2012, Juniper Networks
- Page 49 and 50:
Copyright © 2012, Juniper Networks
- Page 51 and 52:
Copyright © 2012, Juniper Networks
- Page 53 and 54:
Related Documentation • primary;
- Page 55 and 56:
Copyright © 2012, Juniper Networks
- Page 57 and 58:
Copyright © 2012, Juniper Networks
- Page 59 and 60:
Related Documentation • Junos OS
- Page 61 and 62:
Copyright © 2012, Juniper Networks
- Page 63 and 64:
Related Documentation • Junos OS
- Page 65 and 66:
Related Documentation Copyright ©
- Page 67 and 68:
PART 2 Configuring Ethernet Interfa
- Page 69 and 70:
CHAPTER 2 Configuring Ethernet Inte
- Page 71 and 72:
Copyright © 2012, Juniper Networks
- Page 73 and 74:
Copyright © 2012, Juniper Networks
- Page 75 and 76:
Routed traffic is forwarded from an
- Page 77 and 78:
To enable the filtering, include th
- Page 79 and 80:
Configuring Ethernet Loopback Capab
- Page 81 and 82:
By default, the router’s manageme
- Page 83 and 84:
Adjusting the ARP Aging Timer Relat
- Page 85 and 86:
Configuring Multicast Statistics Co
- Page 87 and 88:
CHAPTER 3 Configuring 802.1Q VLANs
- Page 89 and 90:
Related Documentation Dynamically c
- Page 91 and 92:
Configuring Single-Tag Framing Conf
- Page 93 and 94:
family inet { address 10.66.1.2/30;
- Page 95 and 96:
• [edit logical-systems logical-s
- Page 97 and 98:
Copyright © 2012, Juniper Networks
- Page 99 and 100:
Associating a VLAN ID to a VLAN Dem
- Page 101 and 102:
Related Documentation • 802.1Q VL
- Page 103 and 104:
Guidelines for Configuring Logical
- Page 105 and 106:
Specifying the Interface to Handle
- Page 107 and 108:
Example: Configuring a Layer 2 VPN
- Page 109 and 110:
Related Documentation family mpls;
- Page 111 and 112:
Configuring the VLAN ID List for a
- Page 113 and 114:
Related Documentation Copyright ©
- Page 115 and 116:
CHAPTER 4 Configuring Aggregated Et
- Page 117 and 118:
Related Documentation Use the show
- Page 119 and 120:
• Enabling LACP Link Protection o
- Page 121 and 122:
Configuring the Maximum Links Limit
- Page 123 and 124:
Related Documentation status-contro
- Page 125 and 126:
Copyright © 2012, Juniper Networks
- Page 127 and 128:
Copyright © 2012, Juniper Networks
- Page 129 and 130:
Layer 3 Routing • MAC addresses l
- Page 131 and 132:
Figure 9: Multicast Topology with S
- Page 133 and 134:
Configuring MC-LAG Configuring Inte
- Page 135 and 136:
} } Logical Systems logical-system
- Page 137 and 138:
Related Documentation In this examp
- Page 139 and 140:
Typically Supported Network Topolog
- Page 141 and 142:
Pure Layer 2 Topology Without Integ
- Page 143 and 144:
Related Documentation • IGMP snoo
- Page 145 and 146:
• Reverting Traffic to a Primary
- Page 147 and 148:
LACP is defined in IEEE 802.3ad, Ag
- Page 149 and 150:
LACP link protection also uses port
- Page 151 and 152:
Tracing LACP Operations Copyright
- Page 153 and 154:
LACP with Untagged Aggregated Ether
- Page 155 and 156:
Related Documentation • } } For m
- Page 157 and 158:
Related Documentation The multicast
- Page 159 and 160:
Configuring Symmetric Load Balancin
- Page 161 and 162:
Copyright © 2012, Juniper Networks
- Page 163 and 164:
CHAPTER 5 Stacking and Rewriting Gi
- Page 165 and 166:
• push—Add a new VLAN tag to th
- Page 167 and 168:
Table 9: Applying Rewrite Operation
- Page 169 and 170:
Related Documentation • unit on p
- Page 171 and 172:
Table 10: Rewrite Operations and St
- Page 173 and 174:
Related Documentation Removing a VL
- Page 175 and 176:
Related Documentation • [edit log
- Page 177 and 178:
• For more information about bind
- Page 179 and 180:
Example: push-push and pop-pop with
- Page 181 and 182:
Related Documentation swap-swap; Yo
- Page 183 and 184:
Swap a VLAN ID on Ingress Swap a VL
- Page 185 and 186:
Swap the Outer VLAN Tag and Push a
- Page 187 and 188:
Pop an Outer VLAN Tag to Connect an
- Page 189 and 190:
CHAPTER 6 Configuring Layer 2 Bridg
- Page 191 and 192:
CHAPTER 7 Configuring Link Layer Di
- Page 193 and 194:
Copyright © 2012, Juniper Networks
- Page 195 and 196:
Related Documentation You can speci
- Page 197 and 198:
CHAPTER 8 Configuring TCC and Layer
- Page 199 and 200:
Configuring Ethernet TCC • Config
- Page 201 and 202:
CHAPTER 9 Configuring Static ARP Ta
- Page 203 and 204:
CHAPTER 10 Configuring Restricted a
- Page 205 and 206:
Related Documentation Figure 17: Co
- Page 207 and 208:
CHAPTER 11 Configuring MAC Address
- Page 209 and 210:
Related Documentation Copyright ©
- Page 211 and 212:
CHAPTER 12 Enabling Passive Monitor
- Page 213 and 214:
Related Documentation • Junos® O
- Page 215 and 216:
CHAPTER 13 Configuring IEEE 802.1ag
- Page 217 and 218:
Related Documentation Copyright ©
- Page 219 and 220:
Related Documentation • connectiv
- Page 221 and 222:
Related Documentation all maintenan
- Page 223 and 224:
• interval time • loss-threshol
- Page 225 and 226:
Configuring a Maintenance Endpoint
- Page 227 and 228:
Table 15: Lowest Priority Defect Op
- Page 229 and 230:
Related Documentation Copyright ©
- Page 231 and 232:
Configuring a CFM Action Profile Ev
- Page 233 and 234:
Configuring Linktrace Protocol in C
- Page 235 and 236:
Copyright © 2012, Juniper Networks
- Page 237 and 238:
Example E-LMI Configuration Copyrig
- Page 239 and 240:
Copyright © 2012, Juniper Networks
- Page 241 and 242:
Related Documentation Copyright ©
- Page 243 and 244:
Table 18: Type Field Values for Var
- Page 245 and 246:
For configuration information, see
- Page 247 and 248:
Interface: ge-2/0/0.0 Last flapped:
- Page 249 and 250: Copyright © 2012, Juniper Networks
- Page 251 and 252: Identifier MAC address State Interf
- Page 253 and 254: Related Documentation Copyright ©
- Page 255 and 256: Figure 22: CET inter-op Dual Homed
- Page 257 and 258: • IEEE 802.1ag OAM Connectivity F
- Page 259 and 260: • Configuring Maintenance Interme
- Page 261 and 262: Related Documentation Copyright ©
- Page 263 and 264: Related Documentation • connectiv
- Page 265 and 266: Copyright © 2012, Juniper Networks
- Page 267 and 268: Copyright © 2012, Juniper Networks
- Page 269 and 270: [edit protocols oam] ethernet { con
- Page 271 and 272: CHAPTER 14 Configuring ITU-T Y.1731
- Page 273 and 274: ITU-T Y.1731 Frame Delay Measuremen
- Page 275 and 276: Copyright © 2012, Juniper Networks
- Page 277 and 278: Two-Way ETH-DM Frame Counts Each ro
- Page 279 and 280: Related Documentation On-Demand Mod
- Page 281 and 282: The Y.1731 frame transmission for a
- Page 283 and 284: Configuring an Iterator Profile Cop
- Page 285 and 286: Related Documentation Copyright ©
- Page 287 and 288: Guidelines for Configuring Routers
- Page 289 and 290: • CFM maintenance association—N
- Page 291 and 292: Table 24: ETH-DM Statistics Field N
- Page 293 and 294: Table 25: ETH-DM Frame Counts (cont
- Page 295 and 296: Ensuring That Distributed ppm Is No
- Page 297 and 298: 2. Modify the router configuration
- Page 299: Starting a One-Way ETH-DM Session
- Page 303 and 304: Action • To clear the ETH-DM stat
- Page 305 and 306: user@host> show oam ethernet connec
- Page 307 and 308: Table 26: Displaying Iterator Stati
- Page 309 and 310: Clearing Iterator Statistics Purpos
- Page 311 and 312: Copyright © 2012, Juniper Networks
- Page 313 and 314: Copyright © 2012, Juniper Networks
- Page 315 and 316: Copyright © 2012, Juniper Networks
- Page 317 and 318: Related Documentation • Valid in-
- Page 319 and 320: [edit protocols oam ethernet connec
- Page 321 and 322: CHAPTER 15 Configuring IEEE 802.1x
- Page 323 and 324: Related Documentation Configuring t
- Page 325 and 326: CHAPTER 16 Configuring IEEE 802.3ah
- Page 327 and 328: Configuring IEEE 802.3ah OAM Link-F
- Page 329 and 330: Related Documentation You can speci
- Page 331 and 332: • IEEE 802.3ah OAM Link-Fault Man
- Page 333 and 334: Detecting Remote Faults Related Doc
- Page 335 and 336: • Enabling IEEE 802.3ah OAM Suppo
- Page 337 and 338: Monitoring the Loss of Link Adjacen
- Page 339 and 340: Configuring Threshold Values for Fa
- Page 341 and 342: Related Documentation except OAM PD
- Page 343 and 344: Related Documentation Copyright ©
- Page 345 and 346: CHAPTER 17 Configuring VRRP and VRR
- Page 347 and 348: Related Documentation To configure
- Page 349 and 350: CHAPTER 18 Configuring Gigabit Ethe
- Page 351 and 352:
Related Documentation For more info
- Page 353 and 354:
Specifying an Output Priority Map [
- Page 355 and 356:
NOTE: If the remote Ethernet card i
- Page 357 and 358:
Related Documentation • bandwidth
- Page 359 and 360:
Applying a Policer excess-burst-siz
- Page 361 and 362:
Related Documentation Copyright ©
- Page 363 and 364:
CHAPTER 19 Configuring Gigabit Ethe
- Page 365 and 366:
Displaying Autonegotiation Status T
- Page 367 and 368:
Table 30: Mode and Autonegotiation
- Page 369 and 370:
CHAPTER 20 Configuring Gigabit Ethe
- Page 371 and 372:
CHAPTER 21 Configuring the Manageme
- Page 373 and 374:
Related Documentation } } This feat
- Page 375 and 376:
CHAPTER 22 Configuring 10-Gigabit E
- Page 377 and 378:
Copyright © 2012, Juniper Networks
- Page 379 and 380:
• Configuring Control Queue Disab
- Page 381 and 382:
Forwarding Untagged Layer2 Control
- Page 383 and 384:
Example: Handling Oversubscription
- Page 385 and 386:
Capability • vlan-ccc—802.1Q ta
- Page 387 and 388:
CHAPTER 23 Configuring the 10-Gigab
- Page 389 and 390:
CHAPTER 24 Configuring 10-Gigabit E
- Page 391 and 392:
Understanding WAN Framing for 10-Gi
- Page 393 and 394:
CHAPTER 25 Configuring 10-Gigabit E
- Page 395 and 396:
CHAPTER 26 Configuring 10-Gigabit E
- Page 397 and 398:
CHAPTER 27 Configuring 100-Gigabit
- Page 399 and 400:
Related Documentation MPC3E MIC Ove
- Page 401 and 402:
• 2-port 10-Gigabit Ethernet MICs
- Page 403 and 404:
To configure a 100-Gigabit Ethernet
- Page 405 and 406:
• VLAN rules describe how the rou
- Page 407 and 408:
• You cannot include the vlan-id
- Page 409 and 410:
Related Documentation forwards the
- Page 411 and 412:
Related Documentation Copyright ©
- Page 413 and 414:
CHAPTER 28 Configuring 40-Gigabit E
- Page 415 and 416:
Configuring 40-Gigabit Ethernet PIC
- Page 417 and 418:
CHAPTER 29 Configuring Ethernet Int
- Page 419 and 420:
Configuring MAC Filtering on PTX Se
- Page 421 and 422:
Related Documentation As a conseque
- Page 423 and 424:
Related Documentation On PTX Series
- Page 425 and 426:
Configuring Aggregated Ethernet Int
- Page 427 and 428:
CHAPTER 30 Configuring Point-to-Poi
- Page 429 and 430:
PPPoE Stages Copyright © 2012, Jun
- Page 431 and 432:
Related Documentation Copyright ©
- Page 433 and 434:
the name of the AC from which it wa
- Page 435 and 436:
You can also associate a PPPoE dyna
- Page 437 and 438:
Evaluation Order for Matching Clien
- Page 439 and 440:
6. Optionally, specify how many sec
- Page 441 and 442:
Configuring a PPPoE Interface Copyr
- Page 443 and 444:
• [edit logical-systems logical-s
- Page 445 and 446:
Related Documentation Copyright ©
- Page 447 and 448:
Related Documentation 8. (Optional)
- Page 449 and 450:
Configuring the Action Taken for th
- Page 451 and 452:
• Limiting the Number of Active P
- Page 453 and 454:
Reserving a Static PPPoE Interface
- Page 455 and 456:
Disabling the Sending of PPPoE Acce
- Page 457 and 458:
Copyright © 2012, Juniper Networks
- Page 459 and 460:
By default, nothing is traced. When
- Page 461 and 462:
Copyright © 2012, Juniper Networks
- Page 463 and 464:
CHAPTER 31 Configuring Ethernet Aut
- Page 465 and 466:
CLI Configuration Statements Copyri
- Page 467 and 468:
Related Documentation • Ethernet
- Page 469 and 470:
Related Documentation Copyright ©
- Page 471 and 472:
CHAPTER 32 Configuring Ethernet Rin
- Page 473 and 474:
Ring Nodes Ring Node States Failure
- Page 475 and 476:
The routers use an implicit filter
- Page 477 and 478:
Related Documentation control-chann
- Page 479 and 480:
Copyright © 2012, Juniper Networks
- Page 481 and 482:
Copyright © 2012, Juniper Networks
- Page 483 and 484:
Normal Situation—Other Nodes Fail
- Page 485 and 486:
Related Documentation Copyright ©
- Page 487 and 488:
CHAPTER 33 Example Ethernet Configu
- Page 489 and 490:
Related Documentation • } unit 1
- Page 491 and 492:
PART 3 Ethernet Interface Configura
- Page 493 and 494:
CHAPTER 34 Summary of Ethernet Inte
- Page 495 and 496:
agent-specifier Syntax agent-specif
- Page 497 and 498:
aggregated-ether-options Syntax agg
- Page 499 and 500:
auto-negotiation Syntax (auto-negot
- Page 501 and 502:
urst-size-limit (Policer for Gigabi
- Page 503 and 504:
disable Syntax disable; Hierarchy L
- Page 505 and 506:
ethernet (Protocols OAM) Syntax eth
- Page 507 and 508:
status-counter number; polling-veri
- Page 509 and 510:
ethernet-ring Syntax ethernet-ring
- Page 511 and 512:
Required Privilege Default If the e
- Page 513 and 514:
fnp Syntax fnp { interval ;; loss-t
- Page 515 and 516:
flow-control-options Syntax flow-co
- Page 517 and 518:
framing (10-Gigabit Ethernet Interf
- Page 519 and 520:
} Hierarchy Level [edit interfaces
- Page 521 and 522:
ignore-l3-incompletes Syntax ignore
- Page 523 and 524:
inner-vlan-id Syntax inner-vlan-id
- Page 525 and 526:
input-vlan-map See the following se
- Page 527 and 528:
interface Syntax interface (all | i
- Page 529 and 530:
lacp lacp (802.3ad) See the followi
- Page 531 and 532:
link-discovery Syntax link-discover
- Page 533 and 534:
Related Documentation Copyright ©
- Page 535 and 536:
Required Privilege Level Related Do
- Page 537 and 538:
link-speed (Aggregated Ethernet) Sy
- Page 539 and 540:
lldp-configuration-notification-int
- Page 541 and 542:
mac-learn-enable Syntax (mac-learn-
- Page 543 and 544:
max-sessions-vsa-ignore (Static and
- Page 545 and 546:
mep Syntax mep mep-id { auto-discov
- Page 547 and 548:
mip-half-function Syntax mip-half-f
- Page 549 and 550:
no-auto-mdix Syntax no-auto-mdix; H
- Page 551 and 552:
oam Syntax oam { ethernet { connect
- Page 553 and 554:
Description For Ethernet interfaces
- Page 555 and 556:
pado-advertise Syntax pado-advertis
- Page 557 and 558:
periodic Syntax periodic interval;
- Page 559 and 560:
policer (CFM Global) Syntax policer
- Page 561 and 562:
policer (CoS) Syntax policer cos-po
- Page 563 and 564:
pop Syntax pop; Hierarchy Level [ed
- Page 565 and 566:
port-id-subtype Syntax port-id-subt
- Page 567 and 568:
ppp-options Syntax ppp-options { au
- Page 569 and 570:
pppoe-underlying-options (Static an
- Page 571 and 572:
premium (Output Priority Map) Synta
- Page 573 and 574:
Hierarchy Level [edit protocols] re
- Page 575 and 576:
push Syntax push; Hierarchy Level [
- Page 577 and 578:
ing-protection-link-end Syntax ring
- Page 579 and 580:
sa-multicast (100-Gigabit Ethernet)
- Page 581 and 582:
Related Documentation service-name-
- Page 583 and 584:
short-cycle-protection (Static and
- Page 585 and 586:
source-address-filter Syntax source
- Page 587 and 588:
speed speed (Ethernet) See the foll
- Page 589 and 590:
static-interface Syntax static-inte
- Page 591 and 592:
swap-swap Syntax swap-swap; Hierarc
- Page 593 and 594:
system-id Syntax system-id system-i
- Page 595 and 596:
tag-protocol-id (TPID to Rewrite) S
- Page 597 and 598:
traceoptions Syntax traceoptions {
- Page 599 and 600:
traceoptions (PPPoE) Syntax traceop
- Page 601 and 602:
Required Privilege Level Related Do
- Page 603 and 604:
Copyright © 2012, Juniper Networks
- Page 605 and 606:
Copyright © 2012, Juniper Networks
- Page 607 and 608:
(cbr rate | rtvbr burst length peak
- Page 609 and 610:
vlan-id See the following sections:
- Page 611 and 612:
vlan-id (VLAN ID to Rewrite) Syntax
- Page 613 and 614:
vlan-id-list (Ethernet VLAN Circuit
- Page 615 and 616:
vlan-id-range Syntax vlan-id-range
- Page 617 and 618:
vlan-rewrite Syntax vlan-rewrite tr
- Page 619 and 620:
vlan-tagging Syntax vlan-tagging; H
- Page 621 and 622:
vlan-tags (Dual-Tagged Logical Inte
- Page 623 and 624:
vlan-tags (Stacked VLAN Tags) Synta
- Page 625 and 626:
vlan-vci-tagging Syntax vlan-vci-ta
- Page 627 and 628:
Copyright © 2012, Juniper Networks
- Page 629 and 630:
Required Privilege Level Related Do
- Page 631 and 632:
PART 4 Troubleshooting Copyright ©
- Page 633 and 634:
CHAPTER 35 Investigate Fast Etherne
- Page 635 and 636:
h. Ping the interface. i. Check for
- Page 637 and 638:
Table 38: Checklist for Monitoring
- Page 639 and 640:
Meaning This sample output lists on
- Page 641 and 642:
Output packets: 1642918 3 pps Input
- Page 643 and 644:
autonegotiation information of the
- Page 645 and 646:
Table 44: Fiber-Optic Ethernet Inte
- Page 647 and 648:
Create a Loopback • Configure a S
- Page 649 and 650:
use a local or remote statement. Si
- Page 651 and 652:
1. Find the Media Access Control (M
- Page 653 and 654:
Vr HL TOS Len ID Flg off TTL Pro ck
- Page 655 and 656:
Diagnose a Suspected Circuit Proble
- Page 657 and 658:
Description: Test Flags: SNMP-Traps
- Page 659 and 660:
Table 48: Major Fast Ethernet and G
- Page 661 and 662:
PART 5 Index Copyright © 2012, Jun
- Page 663 and 664:
Index Symbols #, comments in config
- Page 665 and 666:
checklist for monitoring Fast Ether
- Page 667 and 668:
family bridge VLAN ID list.........
- Page 669 and 670:
Gigabit Ethernet configuring.......
- Page 671 and 672:
multimode fiber cable..............
- Page 673 and 674:
ewrite VLAN tag on untagged frame u
- Page 675 and 676:
trunk interface interface-mode stat
- Page 677 and 678:
Index of Statements and Commands Sy
- Page 679 and 680:
static PPPoE statements max-session


