London scoping - ukcip
London scoping - ukcip
London scoping - ukcip
Create successful ePaper yourself
Turn your PDF publications into a flip-book with our unique Google optimized e-Paper software.
Final Report<br />
viii<br />
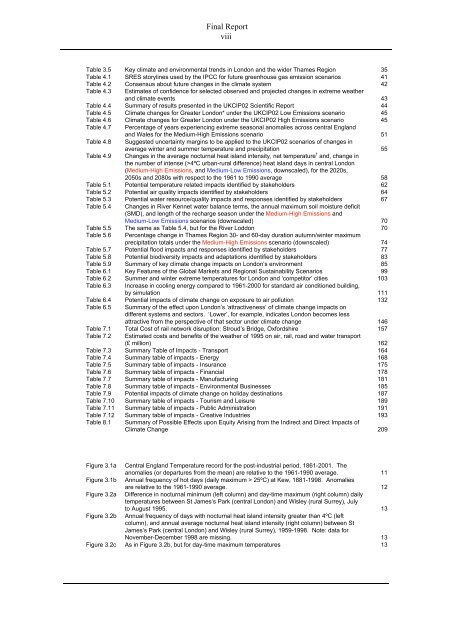
Table 3.5 Key climate and environmental trends in <strong>London</strong> and the wider Thames Region 35<br />
Table 4.1 SRES storylines used by the IPCC for future greenhouse gas emission scenarios 41<br />
Table 4.2 Consensus about future changes in the climate system 42<br />
Table 4.3 Estimates of confidence for selected observed and projected changes in extreme weather<br />
and climate events 43<br />
Table 4.4 Summary of results presented in the UKCIP02 Scientific Report 44<br />
Table 4.5 Climate changes for Greater <strong>London</strong>* under the UKCIP02 Low Emissions scenario 45<br />
Table 4.6 Climate changes for Greater <strong>London</strong> under the UKCIP02 High Emissions scenario 45<br />
Table 4.7 Percentage of years experiencing extreme seasonal anomalies across central England<br />
and Wales for the Medium-High Emissions scenario 51<br />
Table 4.8 Suggested uncertainty margins to be applied to the UKCIP02 scenarios of changes in<br />
average winter and summer temperature and precipitation 55<br />
Table 4.9 Changes in the average nocturnal heat island intensity, net temperature † and, change in<br />
the number of intense (>4ºC urban-rural difference) heat island days in central <strong>London</strong><br />
(Medium-High Emissions, and Medium-Low Emissions, downscaled), for the 2020s,<br />
2050s and 2080s with respect to the 1961 to 1990 average 58<br />
Table 5.1 Potential temperature related impacts identified by stakeholders 62<br />
Table 5.2 Potential air quality impacts identified by stakeholders 64<br />
Table 5.3 Potential water resource/quality impacts and responses identified by stakeholders 67<br />
Table 5.4 Changes in River Kennet water balance terms, the annual maximum soil moisture deficit<br />
(SMD), and length of the recharge season under the Medium-High Emissions and<br />
Medium-Low Emissions scenarios (downscaled) 70<br />
Table 5.5 The same as Table 5.4, but for the River Loddon 70<br />
Table 5.6 Percentage change in Thames Region 30- and 60-day duration autumn/winter maximum<br />
precipitation totals under the Medium-High Emissions scenario (downscaled) 74<br />
Table 5.7 Potential flood impacts and responses identified by stakeholders 77<br />
Table 5.8 Potential biodiversity impacts and adaptations identified by stakeholders 83<br />
Table 5.9 Summary of key climate change impacts on <strong>London</strong>’s environment 85<br />
Table 6.1 Key Features of the Global Markets and Regional Sustainability Scenarios 99<br />
Table 6.2 Summer and winter extreme temperatures for <strong>London</strong> and ‘competitor’ cities 103<br />
Table 6.3 Increase in cooling energy compared to 1961-2000 for standard air conditioned building,<br />
by simulation 111<br />
Table 6.4 Potential impacts of climate change on exposure to air pollution 132<br />
Table 6.5 Summary of the effect upon <strong>London</strong>’s ‘attractiveness’ of climate change impacts on<br />
different systems and sectors. ‘Lower’, for example, indicates <strong>London</strong> becomes less<br />
attractive from the perspective of that sector under climate change 146<br />
Table 7.1 Total Cost of rail network disruption: Stroud’s Bridge, Oxfordshire 157<br />
Table 7.2 Estimated costs and benefits of the weather of 1995 on air, rail, road and water transport<br />
(£ million) 162<br />
Table 7.3 Summary Table of Impacts - Transport 164<br />
Table 7.4 Summary table of impacts - Energy 168<br />
Table 7.5 Summary table of impacts - Insurance 175<br />
Table 7.6 Summary table of impacts - Financial 178<br />
Table 7.7 Summary table of impacts - Manufacturing 181<br />
Table 7.8 Summary table of impacts - Environmental Businesses 185<br />
Table 7.9 Potential impacts of climate change on holiday destinations 187<br />
Table 7.10 Summary table of impacts - Tourism and Leisure 189<br />
Table 7.11 Summary table of impacts - Public Administration 191<br />
Table 7.12 Summary table of impacts - Creative Industries 193<br />
Table 8.1 Summary of Possible Effects upon Equity Arising from the Indirect and Direct Impacts of<br />
Climate Change 209<br />
Figure 3.1a Central England Temperature record for the post-industrial period, 1861-2001. The<br />
anomalies (or departures from the mean) are relative to the 1961-1990 average. 11<br />
Figure 3.1b Annual frequency of hot days (daily maximum > 25ºC) at Kew, 1881-1998. Anomalies<br />
are relative to the 1961-1990 average. 12<br />
Figure 3.2a Difference in nocturnal minimum (left column) and day-time maximum (right column) daily<br />
temperatures between St James’s Park (central <strong>London</strong>) and Wisley (rural Surrey), July<br />
to August 1995. 13<br />
Figure 3.2b Annual frequency of days with nocturnal heat island intensity greater than 4ºC (left<br />
column), and annual average nocturnal heat island intensity (right column) between St<br />
James’s Park (central <strong>London</strong>) and Wisley (rural Surrey), 1959-1998. Note: data for<br />
November-December 1998 are missing. 13<br />
Figure 3.2c As in Figure 3.2b, but for day-time maximum temperatures 13


