- Page 1 and 2: london’swarming The Impacts of Cl
- Page 3 and 4: London Climate Change Partnership A
- Page 5 and 6: Contents Final Report i Executive S
- Page 7 and 8: Final Report iii 5.8 Bibliography 8
- Page 9 and 10: Final Report v 7.3.3 Case Study 156
- Page 11 and 12: Final Report vii 8.5.1 Monitoring I
- Page 13 and 14: Final Report ix Figure 3.3 River Th
- Page 15 and 16: Executive Summary Final Report xi T
- Page 17 and 18: Final Report xiii building and urba
- Page 19 and 20: Final Report 2 There are two study
- Page 21 and 22: Final Report 4
- Page 23 and 24: Final Report 6 In this study histor
- Page 25 and 26: Final Report 8
- Page 27 and 28: Final Report 10 anomalies close to
- Page 29 and 30: "Hot" day anomaly (days) Final Repo
- Page 31 and 32: Final Report 14 3.3 Precipitation (
- Page 33 and 34: Final Report 16 Table 3.1 The five
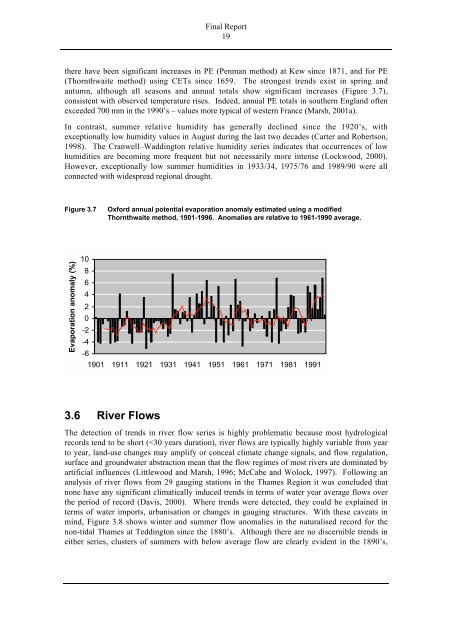
- Page 35: Final Report 18 Figure 3.6 Number o
- Page 39 and 40: Final Report 22 Figure 3.9 Days wit
- Page 41 and 42: metres AOD Final Report 24 Figure 3
- Page 43 and 44: Final Report 26 Figure 3.13 Number
- Page 45 and 46: Final Report 28 quality is monitore
- Page 47 and 48: Final Report 30 Table 3.2 Nature co
- Page 49 and 50: ad11:users:ad11:desktop:final tech
- Page 51 and 52: Final Report 34 Table 3.4 Exemplar
- Page 53 and 54: Climate indicators Recent trend Fin
- Page 55 and 56: Final Report 38 Marsh, T.J. and Mon
- Page 57 and 58: Final Report 40
- Page 59 and 60: Final Report 42 Table 4.2 Consensus
- Page 61 and 62: Final Report 44 Table 4.4 Summary o
- Page 63 and 64: Final Report 46 Figure 4.1 Referenc
- Page 65 and 66: Final Report 48 Precipitation By th
- Page 67 and 68: Final Report 50 Sea Level Rates of
- Page 69 and 70: Final Report 52 representing the un
- Page 71 and 72: Final Report 54 Figure 4.7 Winter (
- Page 73 and 74: Final Report 56 4.7 Statistical Dow
- Page 75 and 76: Final Report 58 1961-90 plus 0.26º
- Page 77 and 78: Final Report 60
- Page 79 and 80: Final Report 62 temperature between
- Page 81 and 82: Final Report 64 Table 5.2 Potential
- Page 83 and 84: Final Report 66 without climate cha
- Page 85 and 86: Final Report 68 paradox is explaine
- Page 87 and 88:
Final Report 70 Table 5.4 Changes i
- Page 89 and 90:
Final Report 72 to withstand floods
- Page 91 and 92:
Final Report 74 Figure 5.5 The 60-d
- Page 93 and 94:
Final Report 76 Figure 5.6 The area
- Page 95 and 96:
Final Report 78 use/restoration of
- Page 97 and 98:
Final Report 80 The most important
- Page 99 and 100:
Final Report 82 of air pollution co
- Page 101 and 102:
Final Report 84 5.6.6 Adaptation Op
- Page 103 and 104:
Final Report 86 Issues Climate vari
- Page 105 and 106:
Final Report 88 Davis, R.J. 2001. T
- Page 107 and 108:
Final Report 90 Klein, R.J.T., Nich
- Page 109 and 110:
Final Report 92 Reed, D.J. 1990. Th
- Page 111 and 112:
Final Report 94
- Page 113 and 114:
Final Report 96 and water supply (e
- Page 115 and 116:
Final Report 98 Medium-Low Emission
- Page 117 and 118:
Final Report 100 Variable Global Ma
- Page 119 and 120:
Final Report 102 6.4 Need for a Com
- Page 121 and 122:
Final Report 104 Figure 6.2 aims to
- Page 123 and 124:
Final Report 106 London’s attract
- Page 125 and 126:
Final Report 108 Figure 6.3 Autonom
- Page 127 and 128:
Final Report 110 levels of confiden
- Page 129 and 130:
Final Report 112 with some arguing
- Page 131 and 132:
Final Report 114 reducing the H/W r
- Page 133 and 134:
Final Report 116 groundwater storag
- Page 135 and 136:
Final Report 118 explored in Tokyo
- Page 137 and 138:
Final Report 120 Temperature Change
- Page 139 and 140:
Final Report 122 development on bro
- Page 141 and 142:
Final Report 124 requirement for fu
- Page 143 and 144:
Final Report 126 Figure 6.4 Flows o
- Page 145 and 146:
Final Report 128 6.11 Lifestyles an
- Page 147 and 148:
Final Report 130 2050s (DoH 2002).
- Page 149 and 150:
Final Report 132 Table 6.4 Potentia
- Page 151 and 152:
Final Report 134 glistening pebbles
- Page 153 and 154:
Final Report 136 is because there w
- Page 155 and 156:
Final Report 138 the very hottest w
- Page 157 and 158:
Final Report 140 Local meetings are
- Page 159 and 160:
Final Report 142 workshop in which
- Page 161 and 162:
Final Report 144 is important to no
- Page 163 and 164:
Final Report 146 Table 6.5 Summary
- Page 165 and 166:
Final Report 148 Martens, W. (1996)
- Page 167 and 168:
Final Report 150
- Page 169 and 170:
Final Report 152 Box 1 A profile of
- Page 171 and 172:
Final Report 154 ‘Y’ indicates
- Page 173 and 174:
Final Report 156 Impacts Due to Win
- Page 175 and 176:
Final Report 158 months would resul
- Page 177 and 178:
7.3.6 Road Transport Final Report 1
- Page 179 and 180:
Final Report 162 It was suggested i
- Page 181 and 182:
Table 7.3 Summary Table of Impacts
- Page 183 and 184:
Final Report 166 In fact it is esti
- Page 185 and 186:
Table 7.4 Summary table of impacts
- Page 187 and 188:
Final Report 170 that a significant
- Page 189 and 190:
Final Report 172 than concrete and
- Page 191 and 192:
Final Report 174 through the implem
- Page 193 and 194:
7.6 Financial Services Final Report
- Page 195 and 196:
Table 7.6 Summary table of impacts
- Page 197 and 198:
Final Report 180 7.7.4 Impacts Due
- Page 199 and 200:
Final Report 182 7.8 Environmental
- Page 202 and 203:
Table 7.8 Summary table of impacts
- Page 204 and 205:
Final Report 187 Table 7.9 Potentia
- Page 206 and 207:
Table 7.10 Summary table of impacts
- Page 208 and 209:
Table 7.11 Summary table of impacts
- Page 210 and 211:
Table 7.12 Summary table of impacts
- Page 212 and 213:
Final Report 195 business strategy,
- Page 214 and 215:
Final Report 197 Sir William Halcro
- Page 216 and 217:
Final Report 8. Summary and Policy
- Page 218 and 219:
Issue Main Points Biodiversity Buil
- Page 220 and 221:
Issue Main Points Final Report 203
- Page 222 and 223:
Climate Impact Adaptation Options L
- Page 224 and 225:
Final Report 207 and will bear the
- Page 226 and 227:
Final Report 209 In an RS world, th
- Page 228 and 229:
Final Report 211 newcomers from acr
- Page 230 and 231:
Final Report 213 policies also stat
- Page 232 and 233:
8.4.2 London Development Agency Fin
- Page 234 and 235:
Final Report 217 present study as w
- Page 236 and 237:
Final Report 219 • Could develope
- Page 238 and 239:
Final Report 221 consider recreatio
- Page 240 and 241:
8.4.7 London Biodiversity Partnersh
- Page 242 and 243:
Final Report 225 8.5.5 Health and C
- Page 244 and 245:
Final Report 227 It is particularly
- Page 246 and 247:
9. Conclusions 9.1 Initial Study Fi
- Page 248 and 249:
Final Report 231 frequency and inte
- Page 250 and 251:
Final Report 233 • Engaged a wide
- Page 252 and 253:
London Waste Thames Gateway London
- Page 254 and 255:
Aim of the Workshop Final Report 23
- Page 256 and 257:
Final Report 239 Table 2 Summary of
- Page 258 and 259:
Final Report 241 The notes made by
- Page 260 and 261:
Final Report 243 • Past populatio
- Page 262 and 263:
• Local Government implementation
- Page 264 and 265:
• Water table • Air conditionin
- Page 266 and 267:
• London Health Observatory Final
- Page 268 and 269:
Flooding Water Resources Air Qualit
- Page 270 and 271:
• Landfill location by river Fina
- Page 272 and 273:
• Tensions are limits to growth F
- Page 274 and 275:
Final Report 257 • Impacts on nat
- Page 276 and 277:
Final Report 259 • How will atmos
- Page 278 and 279:
Final Report 261 • Learn from cli
- Page 280 and 281:
Government Cultural Heritage • De
- Page 282 and 283:
Final Report 265 Where or who is ex
- Page 284 and 285:
• Business - transport + infrastr
- Page 286 and 287:
ECONOMIC OPPORTUNITIES Final Report
- Page 288 and 289:
Final Report 271 • Increased risk
- Page 290 and 291:
Final Report 273 • In Central Lon
- Page 292 and 293:
WORKSHOP EVALUATION Final Report 27
- Page 294 and 295:
Final Report 277 further study to e
- Page 296 and 297:
Final Report 279 Geoff Jenkins Hadl
- Page 298 and 299:
Final Report 281 Appendix C Represe
- Page 300 and 301:
Final Report 283 Climate prediction
- Page 302 and 303:
Final Report 285 GQA General Qualit
- Page 304 and 305:
Final Report 287 Stochastic A proce
- Page 306 and 307:
crime arising from extreme weather
- Page 308 and 309:
open spaces 113, 136-8, 212 increas
- Page 310 and 311:
tunnels (cont) stability 110 Tyndal