Barriers to Diversity in Film – A Research Review – Aug 07
Barriers to Diversity in Film – A Research Review – Aug 07
Barriers to Diversity in Film – A Research Review – Aug 07

Create successful ePaper yourself
Turn your PDF publications into a flip-book with our unique Google optimized e-Paper software.
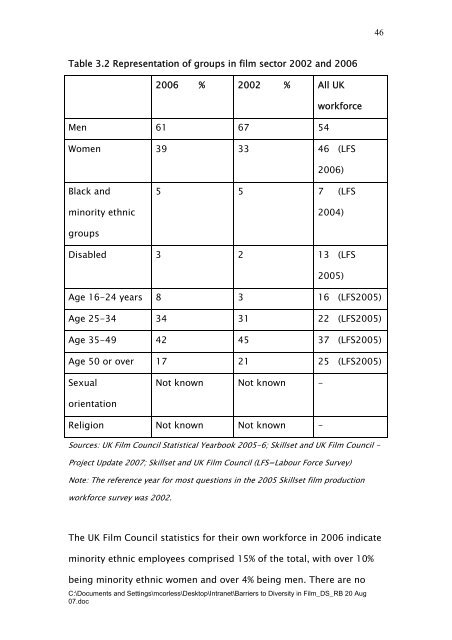
Table 3.2 Representation of groups <strong>in</strong> film sec<strong>to</strong>r 2002 and 2006<br />
2006 % 2002 % All UK<br />
Men 61 67 54<br />
workforce<br />
Women 39 33 46 (LFS<br />
Black and<br />
m<strong>in</strong>ority ethnic<br />
groups<br />
2006)<br />
5 5 7 (LFS<br />
2004)<br />
Disabled 3 2 13 (LFS<br />
2005)<br />
Age 16-24 years 8 3 16 (LFS2005)<br />
Age 25-34 34 31 22 (LFS2005)<br />
Age 35-49 42 45 37 (LFS2005)<br />
Age 50 or over 17 21 25 (LFS2005)<br />
Sexual<br />
orientation<br />
Not known Not known -<br />
Religion Not known Not known -<br />
Sources: UK <strong>Film</strong> Council Statistical Yearbook 2005-6; Skillset and UK <strong>Film</strong> Council -<br />
Project Update 20<strong>07</strong>; Skillset and UK <strong>Film</strong> Council (LFS=Labour Force Survey)<br />
Note: The reference year for most questions <strong>in</strong> the 2005 Skillset film production<br />
workforce survey was 2002.<br />
The UK <strong>Film</strong> Council statistics for their own workforce <strong>in</strong> 2006 <strong>in</strong>dicate<br />
m<strong>in</strong>ority ethnic employees comprised 15% of the <strong>to</strong>tal, with over 10%<br />
be<strong>in</strong>g m<strong>in</strong>ority ethnic women and over 4% be<strong>in</strong>g men. There are no<br />
C:\Documents and Sett<strong>in</strong>gs\mcorless\Desk<strong>to</strong>p\Intranet\<strong>Barriers</strong> <strong>to</strong> <strong>Diversity</strong> <strong>in</strong> <strong>Film</strong>_DS_RB 20 <strong>Aug</strong><br />
<strong>07</strong>.doc<br />
46